 Indietro
Supply and Demand: Foundations of Market Analysis
Guida di studio - Note intelligenti
 Appunti personalizzati basati sui tuoi materiali, ampliati con definizioni chiave, esempi e contesto.
Understanding Individual Markets: Demand and Supply
What Is a Market?
A market is a group of buyers and sellers of a particular good or service. The terms supply and demand refer to the behavior of people as they interact with one another in markets. Markets are fundamental to economic analysis, as they determine how resources are allocated and prices are set.
Demand
Demand is defined as the ability and willingness to buy specific quantities of goods in a given period of time at a particular price. It is the combination of willingness and ability to buy.
Law of Demand: The higher the price of a product, the lower the quantity demanded. The lower the price, the higher the quantity demanded.
Classification of Goods and Services
Goods and services can be classified based on their characteristics and production costs:
Free goods: Goods with no production costs, often gifts of nature (e.g., sunlight, river water, air).
Public goods: Goods commonly used and beneficial to everyone (e.g., public clinics, schools, police protection, roads).
Economic goods and services: Goods that involve production costs and are tangible; economic services are intangible.



Related Goods
Related goods affect demand through their relationship with other products:
Substitute goods: Goods or services that can be used in place of another (e.g., tea vs coffee).
Complementary goods: Goods used together (e.g., bread and butter).
Demand Schedule
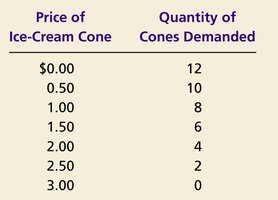
The demand schedule is a table showing the relationship between the price of a good and the quantity demanded.
Price of Ice-Cream Cone | Quantity of Cones Demanded |
|---|---|
$0.00 | 12 |
0.50 | 10 |
1.00 | 8 |
1.50 | 6 |
2.00 | 4 |
2.50 | 2 |
3.00 | 0 |
Demand Curve
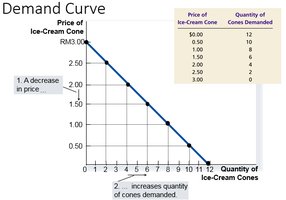
The demand curve is a graph of the relationship between the price of a good and the quantity demanded. It typically slopes downward, reflecting the law of demand.
Market Demand versus Individual Demand
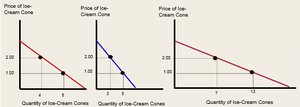
Market demand is the sum of all individual demands for a particular good or service. Individual demand curves are summed horizontally to obtain the market demand curve.
Determinants of Demand
Internal Factors
Price of the product itself: Changes in price cause movements along the demand curve.
External Factors
Price of related goods: Substitute and complementary goods affect demand.
Consumers’ income: Higher income increases demand for normal goods and decreases demand for inferior goods.
Consumers’ tastes and preferences: Popularity increases demand.
Population or number of buyers: More buyers increase demand.
Expectation about future prices: Expected price increases boost current demand.
Festive season and climates: Seasonal factors affect demand for specific goods.
Shifts in the Demand Curve
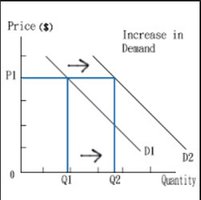
A change in quantity demanded is a movement along the demand curve, caused by a change in price. A change in demand is a shift of the demand curve, caused by external factors. An increase in demand shifts the curve to the right; a decrease shifts it to the left.
Supply
Definition and Law of Supply
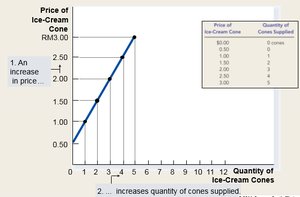
Supply is defined as the ability and willingness to sell specific quantities of goods in a given period of time at a particular price. The law of supply states that the higher the price, the greater the quantity supplied; the lower the price, the lower the quantity supplied.
Supply Schedule
The supply schedule is a table showing the relationship between the price of a good and the quantity supplied.
Supply Curve
The supply curve is a graph of the relationship between the price of a good and the quantity supplied. It typically slopes upward, reflecting the law of supply.
Market Supply versus Individual Supply
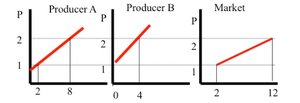
Market supply is the sum of all individual supplies for a particular good or service. Individual supply curves are summed horizontally to obtain the market supply curve.
Determinants of Supply
Price of related goods: Substitutes and complements in production affect supply.
Cost of production: Higher costs decrease supply.
Technological advancement: New technology increases supply.
Number of sellers: More sellers increase supply.
Shifts in the Supply Curve
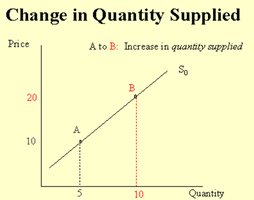
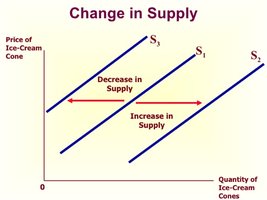
A change in quantity supplied is a movement along the supply curve, caused by a change in price. A change in supply is a shift of the supply curve, caused by other factors. An increase in supply shifts the curve to the right; a decrease shifts it to the left.
Supply and Demand Together: Market Equilibrium
Equilibrium
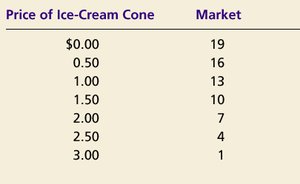
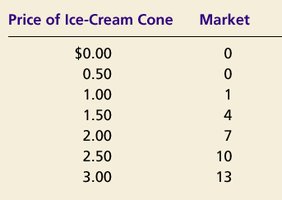
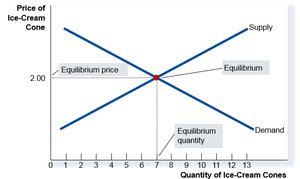
Equilibrium refers to the situation where the price has reached the level at which quantity supplied equals quantity demanded. The equilibrium price is the price that balances supply and demand, and the equilibrium quantity is the quantity at that price.
Demand and Supply Schedules
Price of Ice-Cream Cone | Market Demand |
|---|---|
$0.00 | 19 |
0.50 | 16 |
1.00 | 13 |
1.50 | 10 |
2.00 | 7 |
2.50 | 4 |
3.00 | 1 |
Price of Ice-Cream Cone | Market Supply |
|---|---|
$0.00 | 0 |
0.50 | 0 |
1.00 | 1 |
1.50 | 4 |
2.00 | 7 |
2.50 | 10 |
3.00 | 13 |
Graphical Equilibrium
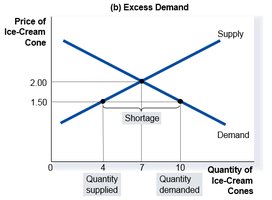
At RM2.00, the quantity demanded equals the quantity supplied. The intersection of the supply and demand curves represents equilibrium.
Surplus and Shortage
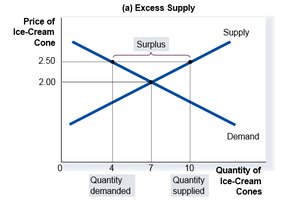
Surplus: When price is above equilibrium, quantity supplied exceeds quantity demanded. Suppliers lower prices to move toward equilibrium.
Shortage: When price is below equilibrium, quantity demanded exceeds quantity supplied. Suppliers raise prices to move toward equilibrium.
Three Steps for Analyzing Changes in Equilibrium
To analyze changes in equilibrium:
Decide whether the event shifts the supply curve, the demand curve, or both.
Decide whether the curve shifts to the right or left.
Use the supply-and-demand diagram to see how the shift affects equilibrium price and quantity.
How an Increase in Demand Affects the Equilibrium
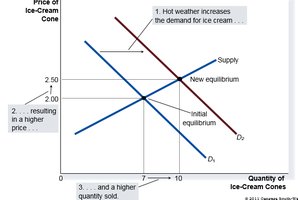
An increase in demand shifts the demand curve to the right, resulting in a higher equilibrium price and quantity.
Shifts in Curves versus Movements along Curves
A shift in the supply curve is called a change in supply.
A movement along a fixed supply curve is called a change in quantity supplied.
A shift in the demand curve is called a change in demand.
A movement along a fixed demand curve is called a change in quantity demanded.
How a Decrease in Supply Affects the Equilibrium
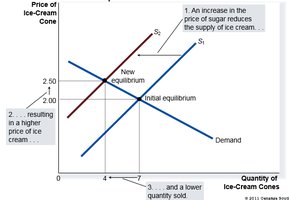
A decrease in supply shifts the supply curve to the left, resulting in a higher equilibrium price and a lower equilibrium quantity.
What Happens to Price and Quantity When Supply or Demand Shifts?
When demand increases (shifts right), both equilibrium price and quantity rise. When supply decreases (shifts left), equilibrium price rises and equilibrium quantity falls. The interplay of supply and demand determines market outcomes.
Key Equations
Demand Function:
Supply Function:
Equilibrium Condition:
Example: If and , set to solve for equilibrium price and quantity.
Additional info: The notes above expand on the original content by providing definitions, examples, and equations for clarity and completeness.
