 Indietro
Supply, Demand, and Market Equilibrium: Core Concepts in Macroeconomics
Guida di studio - Note intelligenti
 Appunti personalizzati basati sui tuoi materiali, ampliati con definizioni chiave, esempi e contesto.
Supply, Demand, and Market Equilibrium
4.1 Markets
Markets are fundamental to economic activity, serving as the arenas where buyers and sellers interact to exchange goods and services. The structure and rules of a market determine how prices are set and how resources are allocated.
Market: A collection of economic agents trading a good or service, governed by explicit or implicit rules.
Market Price: The price at which transactions occur between buyers and sellers. The method of price determination varies by market type.

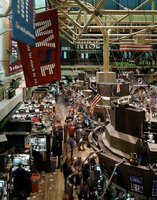
Competitive Market: In a perfectly competitive market, all buyers and sellers transact at the same price, no individual can influence the market price, and all goods are identical.
Perfect competition requires perfect information and no transaction costs.
4.2 Demand: How Do Buyers Behave?
Demand reflects the behavior of buyers in a market. It is represented by the quantity of a good that consumers are willing and able to purchase at various prices, holding other factors constant.
Quantity Demanded: The amount of a good buyers are willing to purchase at a given price.
Demand Curve: A graphical representation showing the relationship between price and quantity demanded, ceteris paribus (all else equal).
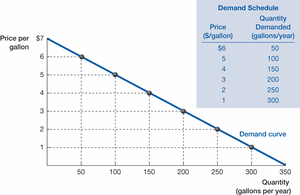
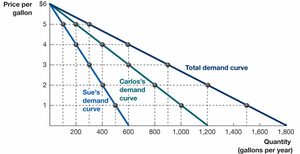
Different consumers may value goods differently, leading to variations in willingness to pay.
Aggregation: Market demand is the sum of individual demand curves.
At higher prices, only high-value uses are satisfied; at lower prices, more uses become viable.
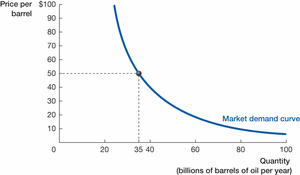
Changes in the price of related goods (e.g., gasoline) can affect the demand for complementary goods (e.g., personal vehicles).

Shifting the Demand Curve
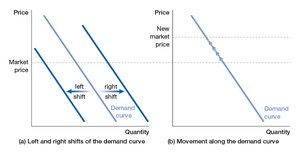
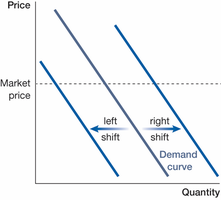
Demand curves can shift due to changes in non-price determinants. A shift in the demand curve indicates a change in demand, while movement along the curve reflects a change in quantity demanded due to price changes.
Change in Demand: The entire demand curve shifts left or right due to factors other than price.
Change in Quantity Demanded: Movement along the demand curve due to a change in the good's price.
Determinants that shift demand:
Tastes and preferences
Income and wealth
Availability and prices of related goods (substitutes and complements)
Number and scale of buyers
Buyers’ expectations about the future
Normal Goods: Demand increases as income rises.
Inferior Goods: Demand decreases as income rises.

Substitutes: Goods that can replace each other; a decrease in the price of one leads to a decrease in demand for the other.
Complements: Goods used together; a decrease in the price of one increases demand for the other.
4.3 Supply: How Do Sellers Behave?
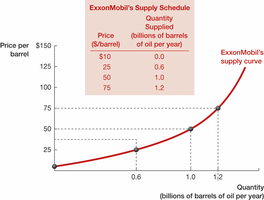
Supply describes the behavior of sellers in a market. It is the quantity of a good that producers are willing and able to sell at various prices, holding other factors constant.
Quantity Supplied: The amount of a good sellers are willing to sell at a given price.
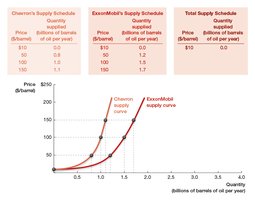
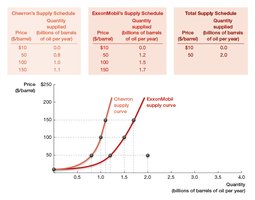
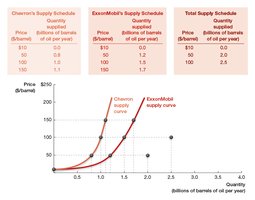
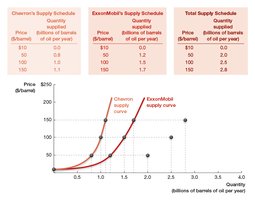
Supply Curve: A graphical representation showing the relationship between price and quantity supplied, ceteris paribus.
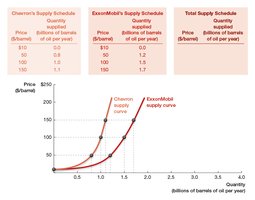
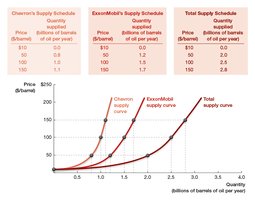
Market Supply Curve: The sum of all individual firms’ supply curves in the market.
Law of Supply: Supply curves typically slope upwards, indicating that higher prices incentivize greater production.
Shifting the Supply Curve
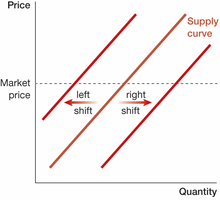
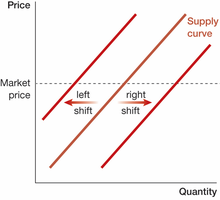
Supply curves shift when non-price determinants change. A shift in the supply curve indicates a change in supply, while movement along the curve reflects a change in quantity supplied due to price changes.
Change in Supply: The entire supply curve shifts left or right due to factors other than price.
Change in Quantity Supplied: Movement along the supply curve due to a change in the good's price.
Determinants that shift supply:
Input prices
Technology
Number and scale of sellers
Sellers’ expectations about the future
Technological improvements lower production costs and increase supply.
More sellers or larger scale increases supply; fewer sellers or smaller scale decreases supply.
Expectations about future prices can affect current supply decisions (e.g., storing crops if higher prices are expected).
4.4 Supply and Demand in Equilibrium
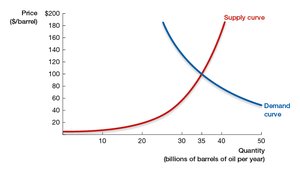
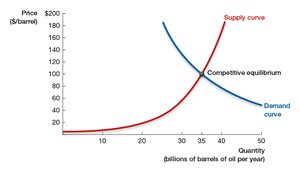
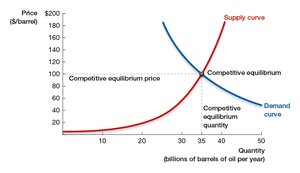
Market equilibrium occurs where the quantity supplied equals the quantity demanded. This intersection determines the equilibrium price and quantity in a competitive market.
Competitive Equilibrium: The price and quantity at which supply and demand are balanced.
Competitive markets tend to converge to this equilibrium point.
Disequilibrium: Excess Supply and Excess Demand
When the market is not at equilibrium, either excess supply (surplus) or excess demand (shortage) occurs, leading to pressure for price adjustments.
Excess Supply (Surplus): Occurs when quantity supplied exceeds quantity demanded at a given price, causing downward pressure on price.
Excess Demand (Shortage): Occurs when quantity demanded exceeds quantity supplied at a given price, causing upward pressure on price.
Shifts in Equilibrium
Changes in supply or demand shift the equilibrium price and quantity. For example, a supply disruption or a surge in demand (e.g., for roses before Valentine’s Day) will alter the market outcome.
Simultaneous shifts in supply and demand can have complex effects on equilibrium price and quantity.
Price Restrictions
Governments sometimes impose price controls, such as price ceilings and price floors, which prevent the market from reaching equilibrium.
Price Ceiling: A maximum legal price, set below equilibrium, leading to shortages.
Price Floor: A minimum legal price, set above equilibrium, leading to surpluses.
Key Equations
Demand Function:
Supply Function:
Equilibrium Condition:
Example Table: Comparison of Price Controls
Type | Definition | Market Effect |
|---|---|---|
Price Ceiling | Maximum legal price below equilibrium | Shortage (excess demand) |
Price Floor | Minimum legal price above equilibrium | Surplus (excess supply) |
Additional info: This summary covers the core concepts of Chapter 4: Supply, Demand, and Market Equilibrium, including graphical analysis, determinants of shifts, and the effects of government intervention in markets.
