 Indietro
Chapter 1: Introduction to Economics – Core Concepts and Graphical Analysis
Guida di studio - Note intelligenti
 Appunti personalizzati basati sui tuoi materiali, ampliati con definizioni chiave, esempi e contesto.
What is Economics?
Definition of Economics
Economics is the study of how individuals and societies allocate scarce resources to satisfy unlimited wants. Because resources are limited, every society must make choices about what to produce, how to produce, and for whom to produce.
Scarcity: The fundamental economic problem of having seemingly unlimited human wants in a world of limited resources.
Choices: Due to scarcity, individuals and societies must prioritize and make decisions about resource allocation.
Example: The problem of scarcity applies to all countries, regardless of their level of development.
Microeconomics vs. Macroeconomics
Economics is divided into two main branches:
Microeconomics: The study of choices made by individuals and businesses, and how these choices interact in markets.
Macroeconomics: The study of the economy as a whole, including issues like inflation, unemployment, and economic growth.
Examples of Microeconomic Topics:
Why a consumer buys less honey
When the price of gas increases, consumers use less gas
Two Big Economic Questions
Core Questions in Economics
Economics seeks to answer two fundamental questions:
How do choices determine what, how, and for whom goods and services are produced?
When do choices made in self-interest also promote the social interest?
Factors of Production: Land, labor, capital, and entrepreneurship are the resources used to produce goods and services.
Entrepreneur: The individual who organizes land, labor, and capital to produce goods and services.
The Economic Way of Thinking
Opportunity Cost
The opportunity cost of an action is the highest-valued alternative that must be forgone to undertake that action.
Example: The opportunity cost of attending university includes tuition, books, and the income you could have earned working instead.
Example: If you travel to Europe instead of working a summer job, your opportunity cost includes the foregone wages and additional expenses.
Marginal Analysis
Rational decision-making involves comparing the marginal benefit (additional benefit from one more unit) to the marginal cost (additional cost from one more unit).
If marginal benefit > marginal cost, increase the activity.
If marginal benefit < marginal cost, decrease the activity.
Tradeoffs
Every choice involves a tradeoff—giving up one thing to get something else.
Example: Choosing to go to the movies instead of studying for an exam may result in a lower test score.
Positive vs. Normative Statements
Positive Statements: Statements that can be tested and validated; describe "what is." Example: If the price of gasoline rises, people will drive less.
Normative Statements: Statements that express opinions or values; describe "what ought to be." Example: Greece is the best place to vacation.
Self-Interest and Social Interest
Economic decisions are often made in self-interest, but they can also promote the social interest (well-being of society as a whole).
Example: A company expanding into a new market may benefit itself and also provide new choices for consumers.
Graphing in Economics
Economic Variables and Relationships
Economists use variables (such as price, quantity, cost, etc.) to describe and analyze relationships. These relationships can be expressed in words, symbols, equations, or graphs.
Common Economic Variables: P (price), Q (quantity), C (cost), L (labor), K (capital), Profit
Types of Graphical Relationships
Graphs are used to visualize how variables interact. Key patterns include:
Variables move in the same direction (positive relationship)
Variables move in opposite directions (negative relationship)
Variables have a maximum or minimum
Variables are unrelated
The Slope of a Relationship
The slope measures the rate at which one variable changes with respect to another. For a straight line, the slope is constant and calculated as "rise over run." For a curve, the slope at a point is the slope of the tangent at that point.
Formula for Slope:
Example: If the slope is -5/4, for every 4 units increase in x, y decreases by 5 units.
Example: The equation y = 20 + 4x describes a straight line with a slope of 4.
Graphing Relationships Among More Than Two Variables
Sometimes, economic relationships involve more than two variables. In such cases, economists may use three-dimensional graphs or hold some variables constant to analyze the relationship between two variables at a time.
Graphical Example: Household Expenditure vs. Income
The following graph shows the relationship between household income and household expenditure. The slope of the line can be calculated to analyze how expenditure changes with income.
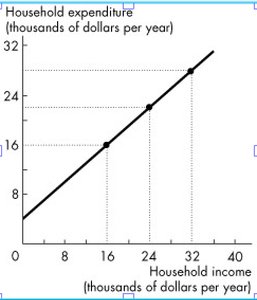
Equation: If the line passes through (0,8), (16, 20), and (32, 32), the slope is:
This means that for every additional $1,000 in income, household expenditure increases by $750.
Additional info: Understanding how to interpret and calculate slopes is essential for analyzing supply and demand curves, cost functions, and other economic relationships in later chapters.
