 Indietro
Demand, Supply, and Market Equilibrium: Core Concepts in Microeconomics
Guida di studio - Note intelligenti
 Appunti personalizzati basati sui tuoi materiali, ampliati con definizioni chiave, esempi e contesto.
Markets and Prices
Competitive Markets and Price Concepts
A market is any arrangement that enables buyers and sellers to obtain information and conduct business. A competitive market is characterized by many buyers and sellers, such that no single participant can influence the market price. The money price of a good is the amount of money required to purchase it, while the relative price is the ratio of the money price of one good to another, representing its opportunity cost.
Opportunity Cost: The value of the next best alternative forgone when making a choice.
Relative Price Formula: $ \text{Relative Price of Good X} = \frac{\text{Money Price of Good X}}{\text{Money Price of Good Y}} $

Demand
Definition and Law of Demand
Demand refers to the entire relationship between the price of a good and the quantity consumers are willing and able to buy at each price, holding other factors constant. The law of demand states that, ceteris paribus, as the price of a good rises, the quantity demanded falls, and as the price falls, the quantity demanded rises.
Quantity Demanded: The amount consumers plan to buy during a specific period at a particular price.
Law of Demand: Inverse relationship between price and quantity demanded.
Reasons for Law of Demand:
Substitution Effect: As the price of a good rises, consumers switch to substitutes.
Income Effect: A higher price reduces consumers' purchasing power, decreasing quantity demanded.
Demand Curve and Schedule
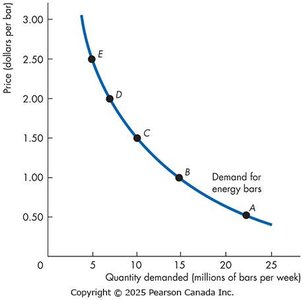
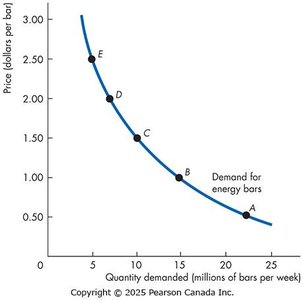
The demand curve graphically represents the relationship between price and quantity demanded. A demand schedule is a table showing quantities demanded at various prices.
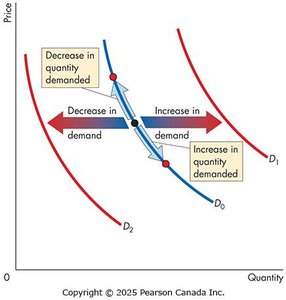
Movement Along the Demand Curve: Caused by a change in the good's price.
Shift of the Demand Curve: Caused by changes in non-price determinants (e.g., income, preferences).
Willingness to Pay and Marginal Benefit
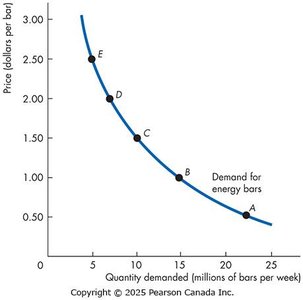
The demand curve also reflects consumers' willingness and ability to pay for additional units, which measures the marginal benefit of consumption.
Determinants of Demand (Shifts in Demand)
Factors other than price that shift the demand curve include:
Prices of Related Goods: Substitutes and complements
Expected Future Prices
Income: Normal vs. inferior goods
Expected Future Income and Credit
Population
Preferences
Substitute: A good that can replace another (e.g., tea and coffee). Complement: A good used together with another (e.g., coffee and sugar).
Shifts in the Demand Curve
An increase in demand shifts the curve rightward; a decrease shifts it leftward. For example, higher income increases demand for normal goods.
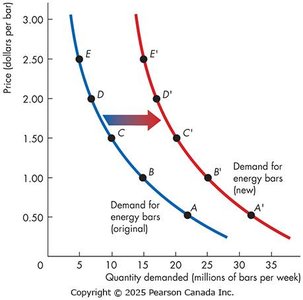
Change in Quantity Demanded vs. Change in Demand
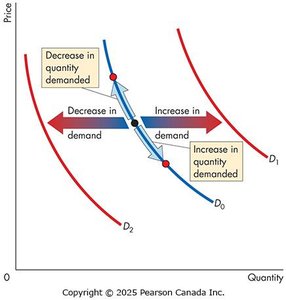
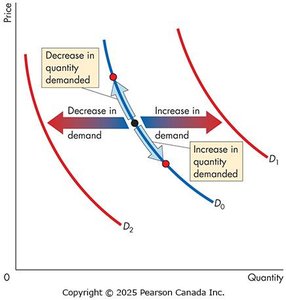
A change in quantity demanded is a movement along the demand curve due to a price change. A change in demand is a shift of the entire curve due to other factors.
Supply
Definition and Law of Supply
Supply is the entire relationship between the price of a good and the quantity producers are willing and able to sell at each price, holding other factors constant. The law of supply states that, ceteris paribus, as the price of a good rises, the quantity supplied increases, and as the price falls, the quantity supplied decreases.
Quantity Supplied: The amount producers plan to sell during a specific period at a particular price.
Law of Supply: Direct relationship between price and quantity supplied.
Reason: Marginal cost of production typically rises as output increases.
Supply Curve and Schedule
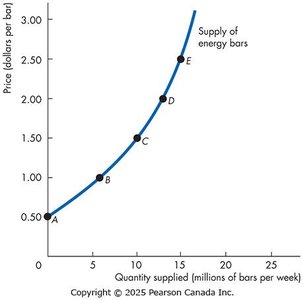
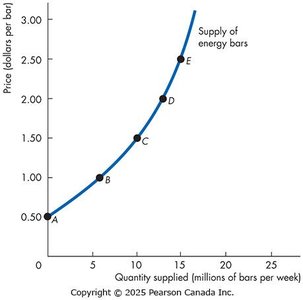
The supply curve shows the relationship between price and quantity supplied. A supply schedule is a table of quantities supplied at different prices.
Minimum Supply Price and Marginal Cost
The supply curve also represents the minimum-supply-price curve, indicating the lowest price at which producers are willing to sell an additional unit, which equals the marginal cost.
Determinants of Supply (Shifts in Supply)
Factors that shift the supply curve include:
Prices of Factors of Production: Higher input costs decrease supply.
Prices of Related Goods Produced: Substitutes and complements in production.
Expected Future Prices: Anticipated higher prices may decrease current supply.
Number of Suppliers: More suppliers increase market supply.
Technology: Technological advances increase supply.
State of Nature: Natural events (e.g., weather) can affect supply.
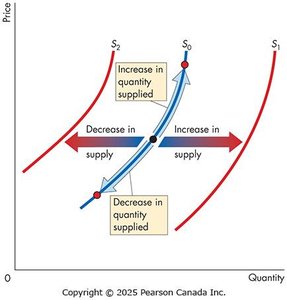
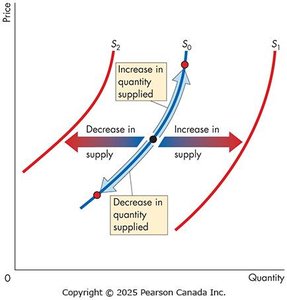
Shifts in the Supply Curve
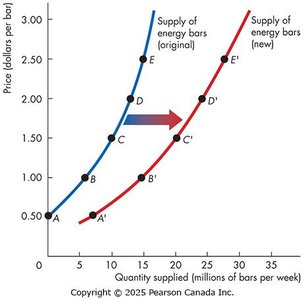
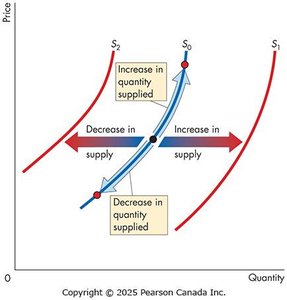
An increase in supply shifts the curve rightward; a decrease shifts it leftward. For example, technological improvements increase supply.
Change in Quantity Supplied vs. Change in Supply
A change in quantity supplied is a movement along the supply curve due to a price change. A change in supply is a shift of the entire curve due to other factors.
Market Equilibrium
Equilibrium Price and Quantity
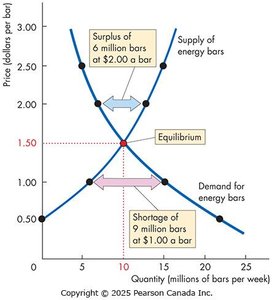
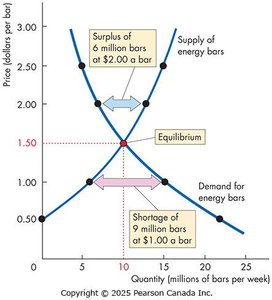
Market equilibrium occurs when the quantity demanded equals the quantity supplied at a particular price. The equilibrium price is where buyers' and sellers' plans are balanced, and the equilibrium quantity is the amount bought and sold at this price.
Surplus: Occurs when quantity supplied exceeds quantity demanded at a given price, causing price to fall.
Shortage: Occurs when quantity demanded exceeds quantity supplied at a given price, causing price to rise.
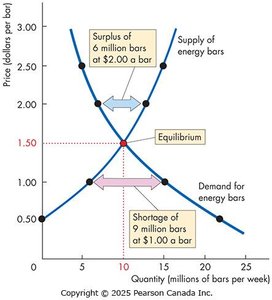
Market Equilibrium Table
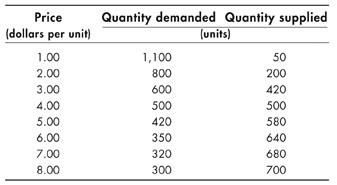
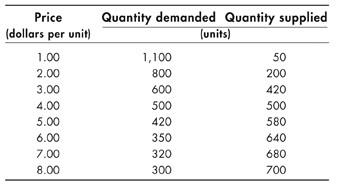
The following table summarizes the relationship between price, quantity demanded, and quantity supplied:
Price (dollars per unit) | Quantity demanded (units) | Quantity supplied (units) |
|---|---|---|
1.00 | 1,100 | 50 |
2.00 | 800 | 200 |
3.00 | 600 | 420 |
4.00 | 500 | 500 |
5.00 | 420 | 580 |
6.00 | 350 | 640 |
7.00 | 320 | 680 |
8.00 | 300 | 700 |
Predicting Changes in Price and Quantity
Effects of Changes in Demand and Supply
Shifts in demand and/or supply curves affect equilibrium price and quantity:
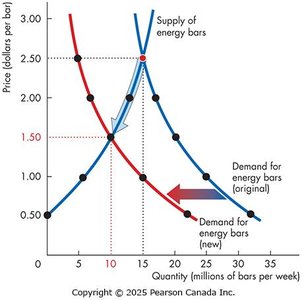
Increase in Demand: Raises both equilibrium price and quantity.
Decrease in Demand: Lowers both equilibrium price and quantity.
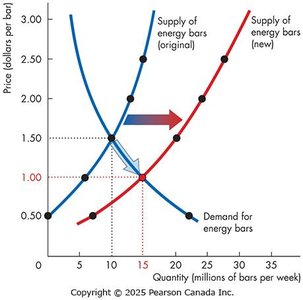
Increase in Supply: Lowers equilibrium price, raises equilibrium quantity.
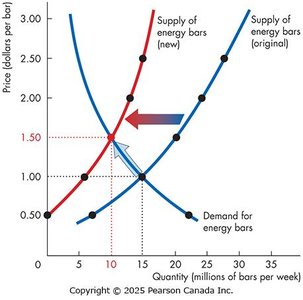
Decrease in Supply: Raises equilibrium price, lowers equilibrium quantity.
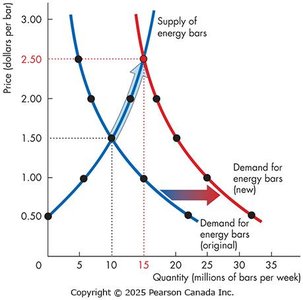
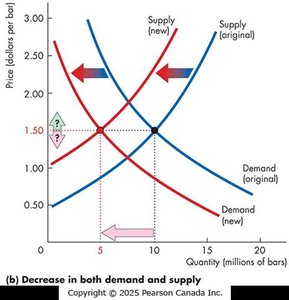
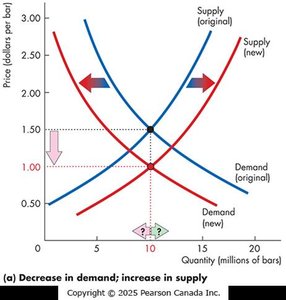
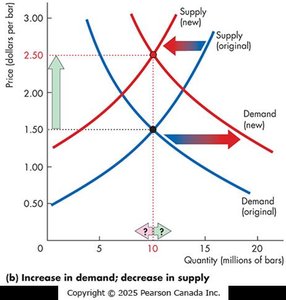
Simultaneous Changes in Demand and Supply
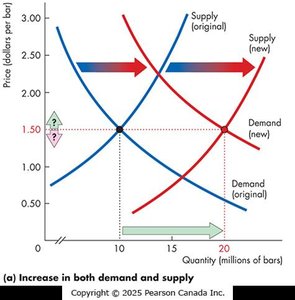
Both Increase: Equilibrium quantity rises; price change is uncertain.
Both Decrease: Equilibrium quantity falls; price change is uncertain.
Demand Increases, Supply Decreases: Price rises; quantity change is uncertain.
Demand Decreases, Supply Increases: Price falls; quantity change is uncertain.
Additional info: These notes cover the foundational microeconomic concepts of demand, supply, and market equilibrium, including the effects of shifts in demand and supply on market outcomes. The included images reinforce key graphical and tabular representations essential for exam preparation.
