 Indietro
Elasticity in Microeconomics: Price, Income, Cross, and Supply Elasticities
Guida di studio - Note intelligenti
 Appunti personalizzati basati sui tuoi materiali, ampliati con definizioni chiave, esempi e contesto.
Elasticity
Introduction to Elasticity
Elasticity is a fundamental concept in microeconomics that measures the responsiveness of one variable to changes in another. In this chapter, we focus on price elasticity of demand, income elasticity of demand, cross elasticity of demand, and elasticity of supply. Understanding elasticity helps explain how consumers and producers react to changes in prices, incomes, and related goods.
Price Elasticity of Demand
Definition and Calculation
The price elasticity of demand is a units-free measure of the responsiveness of the quantity demanded of a good to a change in its price, holding all other influences constant. It is calculated as:
Formula:
Percentage changes are calculated using the average of the initial and new values for both price and quantity.
Example Calculation
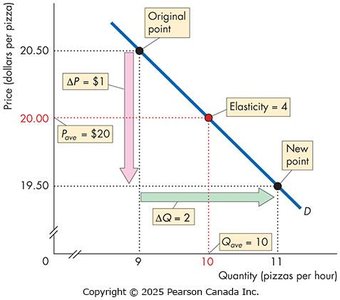
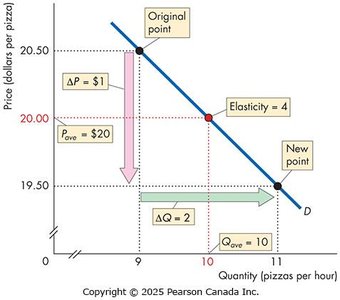
Initial price: $20.50, quantity demanded: 9 pizzas/hour
New price: $19.50, quantity demanded: 11 pizzas/hour
Average price: $20, average quantity: 10
Percentage change in quantity:
Percentage change in price:
Elasticity:
Properties of Price Elasticity
Elasticity is units-free and unaffected by the units of measurement.
The formula yields a negative value, but the absolute value is used to measure responsiveness.
Types of Price Elasticity of Demand
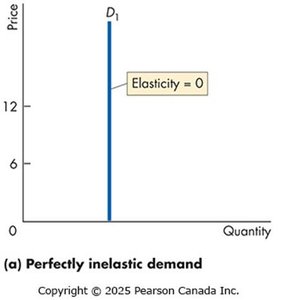
Perfectly Inelastic Demand: Elasticity = 0; quantity demanded does not change with price. Demand curve is vertical.
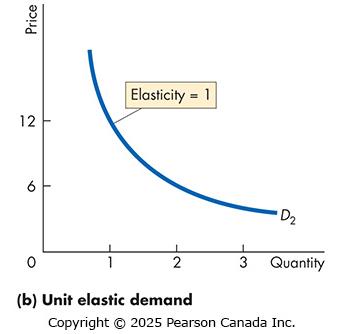
Unit Elastic Demand: Elasticity = 1; percentage change in quantity equals percentage change in price.
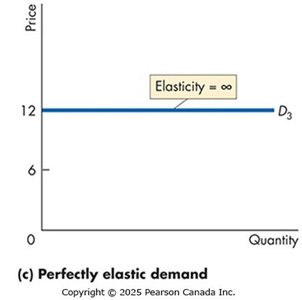
Perfectly Elastic Demand: Elasticity = ∞; quantity demanded changes infinitely with a tiny change in price. Demand curve is horizontal.
Inelastic Demand: Elasticity < 1; quantity demanded changes less than price.
Elastic Demand: Elasticity > 1; quantity demanded changes more than price.
Factors Influencing Price Elasticity of Demand
Closeness of Substitutes: More substitutes make demand more elastic.
Proportion of Income Spent: Higher proportion increases elasticity.
Time Elapsed Since Price Change: More time increases elasticity.
Elasticity Along a Linear Demand Curve
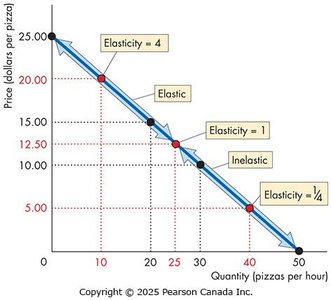
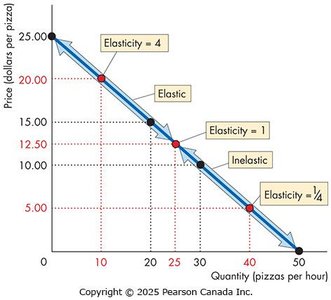
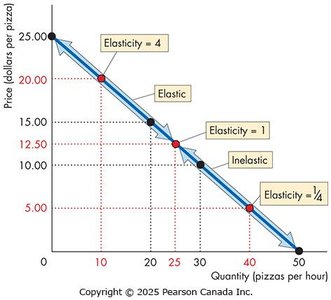
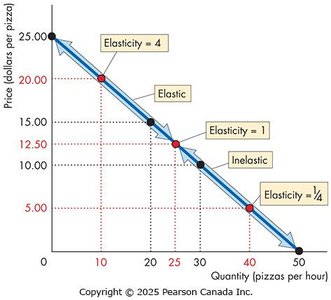
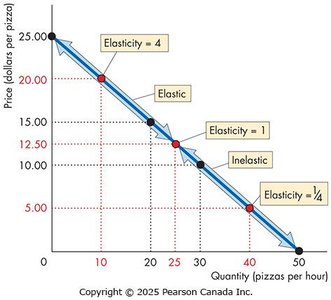
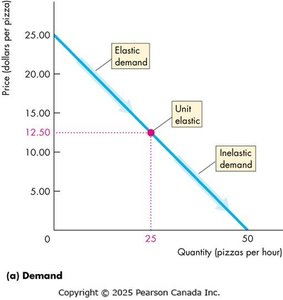
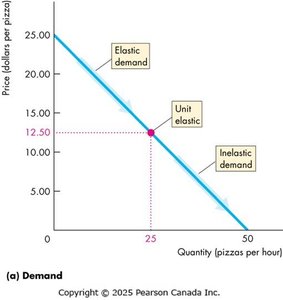
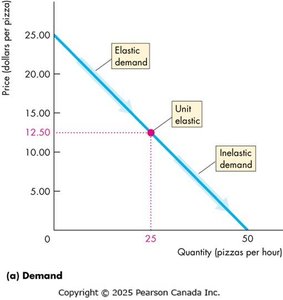
Elasticity varies along a linear demand curve. At the midpoint, demand is unit elastic; above the midpoint, demand is elastic; below, it is inelastic.
Example Calculations Along the Curve
Price falls from $25 to $15: Elasticity = 4 (elastic)
Price falls from $10 to $0: Elasticity = 1/4 (inelastic)
Price falls from $15 to $10: Elasticity = 1 (unit elastic)
Total Revenue and Elasticity
Relationship Between Total Revenue and Elasticity
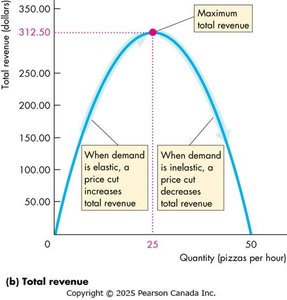
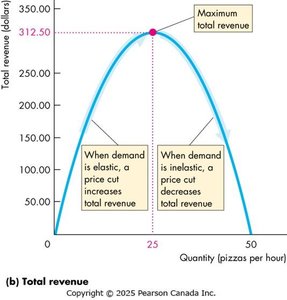
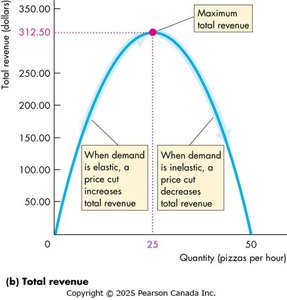
Total revenue equals price multiplied by quantity sold. The effect of a price change on total revenue depends on the elasticity of demand:
If demand is elastic, a price cut increases total revenue.
If demand is inelastic, a price cut decreases total revenue.
If demand is unit elastic, a price cut leaves total revenue unchanged.
Total Revenue Test
If a price cut increases total revenue, demand is elastic.
If a price cut decreases total revenue, demand is inelastic.
If a price cut leaves total revenue unchanged, demand is unit elastic.
Income Elasticity of Demand
Definition and Calculation
The income elasticity of demand measures how the quantity demanded of a good responds to a change in income, holding other factors constant.
Formula:
If elasticity > 1: demand is income elastic (normal good)
If elasticity > 0 but < 1: demand is income inelastic (normal good)
If elasticity < 0: the good is inferior
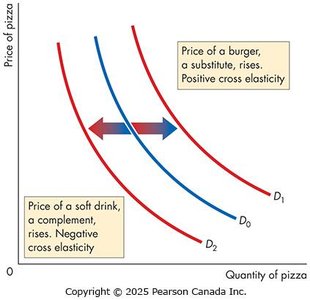
Cross Elasticity of Demand
Definition and Calculation
The cross elasticity of demand measures the responsiveness of demand for a good to a change in the price of a substitute or complement.
Formula:
Substitutes: positive cross elasticity
Complements: negative cross elasticity
Elasticity of Supply
Definition and Calculation
The elasticity of supply measures the responsiveness of the quantity supplied to a change in the price of a good, holding other influences constant.
Formula:
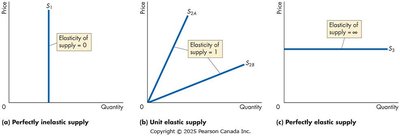
Perfectly inelastic supply: elasticity = 0 (vertical supply curve)
Unit elastic supply: elasticity = 1 (linear supply curve through origin)
Perfectly elastic supply: elasticity = ∞ (horizontal supply curve)
Factors Influencing Elasticity of Supply
Resource Substitution Possibilities: Greater substitution increases elasticity.
Time Frame for Supply Decision: More time increases elasticity. Momentary supply is perfectly inelastic; short-run supply is somewhat elastic; long-run supply is most elastic.
Glossary of Elasticities
Summary Table: Types of Elasticity
Elasticity Type | Value | Description |
|---|---|---|
Perfectly elastic demand | Infinity | Small price change causes infinite quantity change |
Elastic demand | >1 | Quantity changes more than price |
Unit elastic demand | 1 | Quantity changes equal to price |
Inelastic demand | <1 | Quantity changes less than price |
Perfectly inelastic demand | 0 | Quantity does not change with price |
Income elastic (normal good) | >1 | Quantity changes more than income |
Income inelastic (normal good) | <1 but >0 | Quantity changes less than income |
Negative (inferior good) | <0 | Quantity decreases as income increases |
Substitutes (cross elasticity) | Positive | Quantity increases as price of substitute increases |
Complements (cross elasticity) | Negative | Quantity decreases as price of complement increases |
Perfectly elastic supply | Infinity | Small price change causes infinite supply change |
Elastic supply | >1 | Supply changes more than price |
Unit elastic supply | 1 | Supply changes equal to price |
Inelastic supply | <1 but >0 | Supply changes less than price |
Perfectly inelastic supply | 0 | Supply does not change with price |
Practice and Application
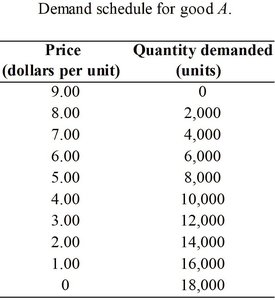
Example Table: Demand Schedule for Good A
Price (dollars per unit) | Quantity demanded (units) |
|---|---|
9.00 | 0 |
8.00 | 2,000 |
7.00 | 4,000 |
6.00 | 6,000 |
5.00 | 8,000 |
4.00 | 10,000 |
3.00 | 12,000 |
2.00 | 14,000 |
1.00 | 16,000 |
0 | 18,000 |
Summary
Elasticity is a key concept for understanding consumer and producer behavior in response to changes in price, income, and related goods. It is essential for predicting market outcomes and for making informed business and policy decisions.
