 Indietro
Mass Spectrometry, Infrared Spectroscopy, and Ultraviolet/Visible Spectroscopy: Structural Elucidation in Organic Chemistry
Guida di studio - Note intelligenti
 Appunti personalizzati basati sui tuoi materiali, ampliati con definizioni chiave, esempi e contesto.
Mass Spectrometry
Principles and Process
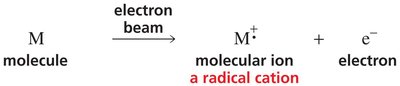
Mass spectrometry is a powerful analytical technique used to determine the molecular mass and structural features of organic compounds. The process involves ionizing a molecule with an electron beam, resulting in the formation of a molecular ion (a radical cation) and an electron.
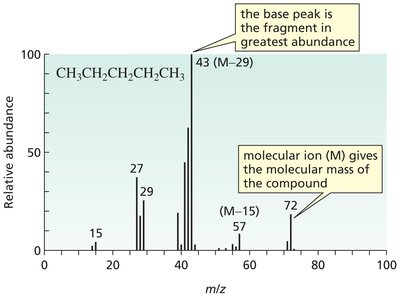
Molecular Ion (M+): The ion formed by the loss of an electron from the molecule; its mass-to-charge ratio (m/z) gives the molecular mass.
Fragmentation: The molecular ion can break into smaller fragments, each with a characteristic m/z value.
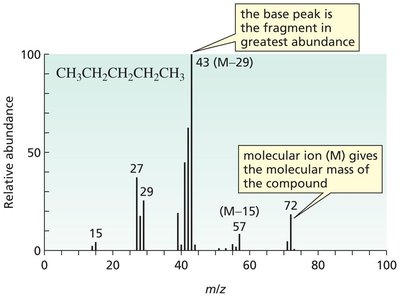
Base Peak: The most abundant fragment in the spectrum, often corresponding to the most stable ion.
Fragmentation Patterns
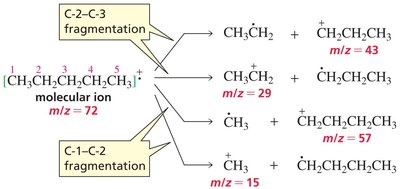
Fragmentation occurs at specific bonds, often those that produce the most stable cations. The pattern of fragmentation helps deduce the structure of the compound.
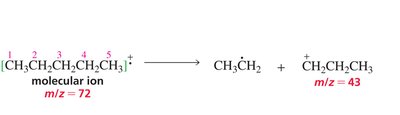
C-2—C-3 Fragmentation: Produces a base peak at m/z 43 for pentane, indicating a stable propyl cation.
C-1—C-2 Fragmentation: Produces smaller fragments such as methyl cation (m/z 15).


Mass Spectra of Alkanes and Isomers
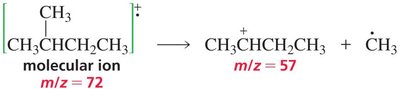
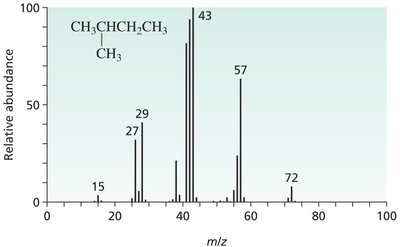
Isomers can be distinguished by their fragmentation patterns and the relative abundance of peaks. For example, isopentane shows a more abundant peak at m/z 57 due to the stability of the secondary carbocation.
Mass Spectra of Alkyl Halides
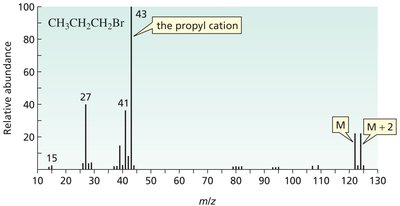
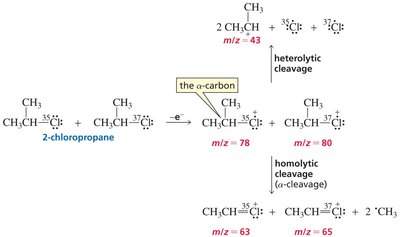
Alkyl halides show characteristic isotopic patterns due to the presence of bromine or chlorine. Bromine has two isotopes (79Br and 81Br) with nearly equal abundance, resulting in two M+ peaks two mass units apart. Chlorine (35Cl and 37Cl) shows a 3:1 ratio in peak intensities.
Heterolytic Cleavage: The carbon-halogen bond breaks, producing characteristic fragments.
α-Cleavage: Homolytic cleavage of the carbon-carbon bond adjacent to the halogen.


Mass Spectra of Ethers, Alcohols, and Ketones
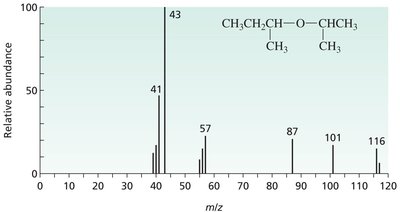
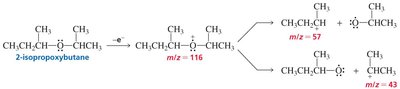
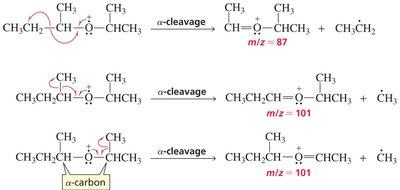
Ethers, alcohols, and ketones exhibit characteristic fragmentation patterns, often involving α-cleavage and rearrangements. The mass spectra provide information about the functional groups present.
α-Cleavage in Ethers: Produces fragments at m/z 57 and 43.
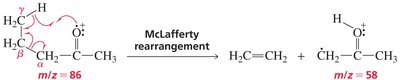
McLafferty Rearrangement in Ketones: Involves migration of a hydrogen atom, producing resonance-stabilized ions.
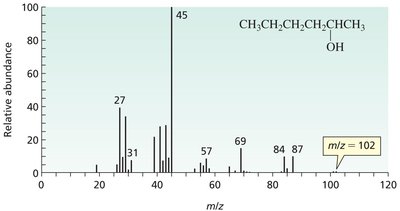
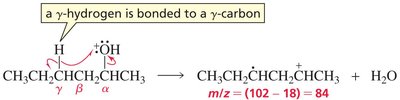
Alcohols: Show loss of water and α-cleavage fragments.


Fragmentation Behavior Summary
Bonds between carbon and atoms of similar electronegativity break homolytically (e.g., alkanes).
Bonds between carbon and more electronegative atoms break heterolytically (e.g., alkyl halides, alcohols).
Weakest bonds and those forming the most stable cations are most likely to break.
Infrared (IR) Spectroscopy
Principles and the Electromagnetic Spectrum
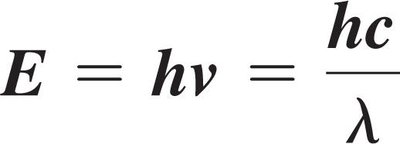
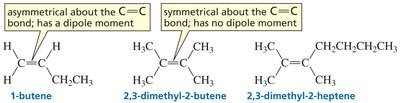
IR spectroscopy measures the absorption of infrared radiation by molecules, causing vibrational transitions. Only bonds whose dipole moment changes during vibration are IR active.
Energy and Frequency Relationship:
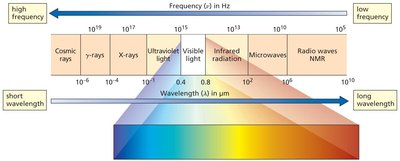
IR region lies between visible and microwave regions of the electromagnetic spectrum.
Types of Vibrations
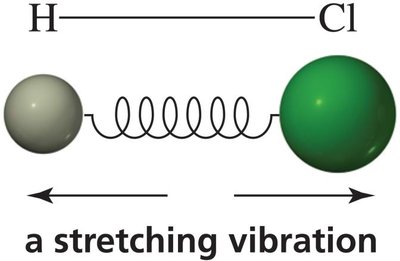
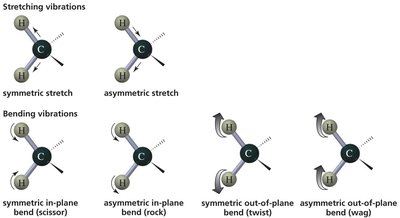
Molecular vibrations include stretching and bending modes. Stretching occurs along the bond axis, while bending involves changes in bond angles.
Stretching Vibrations: Symmetric and asymmetric.
Bending Vibrations: Scissoring, rocking, twisting, wagging.
Characteristic IR Absorptions
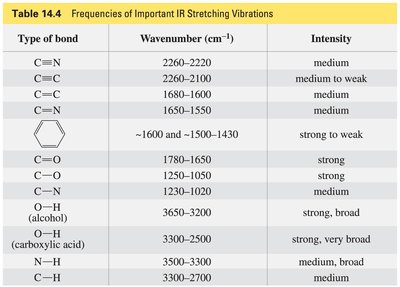
Each functional group absorbs IR radiation at a characteristic wavenumber. The IR spectrum is divided into the functional group region (4000–1400 cm–1) and the fingerprint region (1400–600 cm–1).
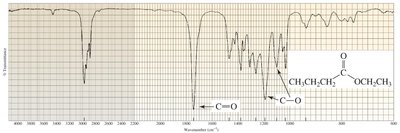
C=O: ~1700 cm–1
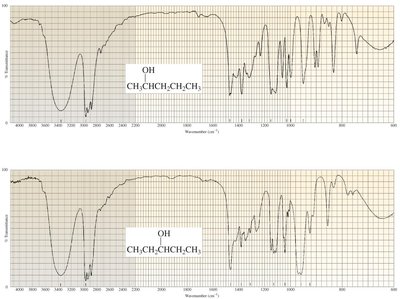
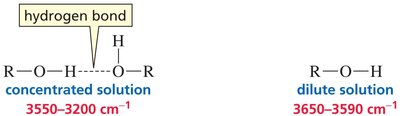
O–H: ~3400 cm–1

Factors Affecting IR Absorption
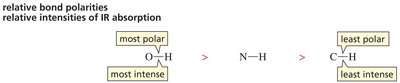
Bond Polarity: More polar bonds absorb more intensely (O–H > N–H > C–H).
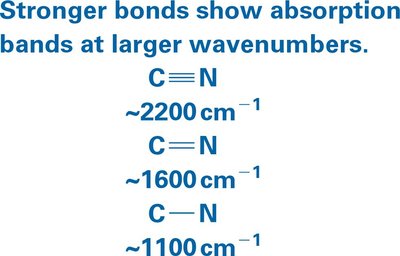
Bond Order: Higher bond order leads to higher wavenumber absorption.
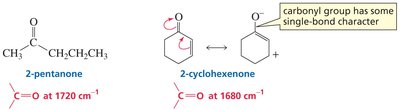
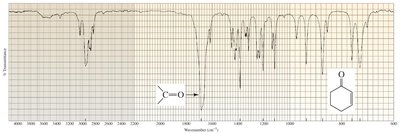
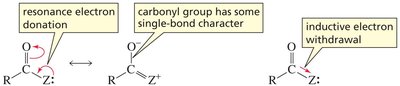
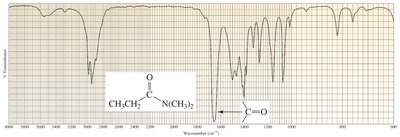
Resonance and Electron Delocalization: Resonance lowers the frequency of absorption; inductive withdrawal increases it.
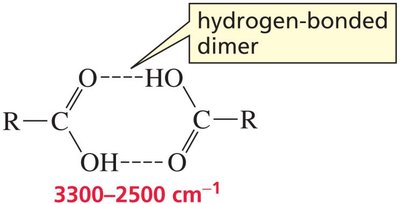
Hydrogen Bonding: Hydrogen-bonded O–H stretches appear at lower frequencies.

IR Absorption Tables
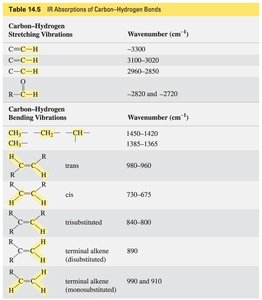
Tables summarize the characteristic wavenumbers and intensities for various functional groups and bond types.
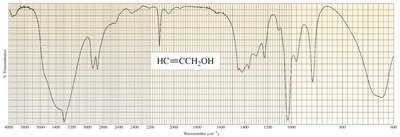
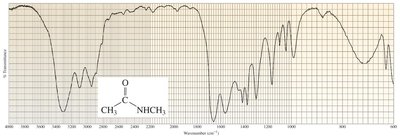
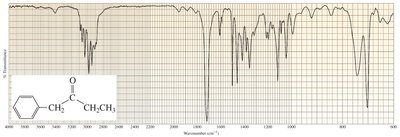
IR Spectra Examples
IR spectra of specific compounds illustrate the assignment of peaks to functional groups.
Ultraviolet/Visible (UV/Vis) Spectroscopy
Principles and Applications
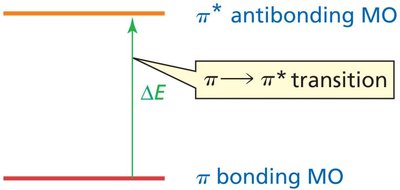
UV/Vis spectroscopy is used to study compounds with conjugated double bonds. It measures the absorption of ultraviolet (100–400 nm) and visible (400–700 nm) light, causing electronic transitions.
Chromophore: The part of the molecule responsible for UV/Vis absorption.
Auxochrome: A substituent that alters the position and intensity of absorption.
Beer–Lambert Law: (A = absorbance, c = concentration, l = path length, \varepsilon = molar absorptivity).
Conjugation and Wavelength
Greater conjugation in a molecule leads to absorption at longer wavelengths. Colored compounds absorb visible light (>400 nm).
UV/Vis absorption bands are broad due to vibrational sublevels.
Conjugation makes electronic transitions easier and shifts absorption to longer wavelengths.
Summary Table: Spectroscopic Techniques
Technique | Information Provided | Key Features |
|---|---|---|
Mass Spectrometry | Molecular mass, fragmentation pattern | m/z values, base peak, isotopic patterns |
IR Spectroscopy | Functional groups, bond types | Characteristic wavenumbers, intensity, hydrogen bonding |
UV/Vis Spectroscopy | Conjugation, electronic transitions | Absorption wavelength, chromophore, auxochrome |
Example: Mass spectrometry distinguishes pentane from isopentane by the abundance of the m/z 57 peak. IR spectroscopy identifies functional groups by their characteristic absorption bands. UV/Vis spectroscopy reveals the extent of conjugation in organic molecules.
Additional info: These notes cover the essential principles and applications of mass spectrometry, IR, and UV/Vis spectroscopy as outlined in Chapter 13 of a typical Organic Chemistry curriculum.
