 Indietro
Acceleration and Motion in One Dimension: Study Notes
Guida di studio - Note intelligenti
 Appunti personalizzati basati sui tuoi materiali, ampliati con definizioni chiave, esempi e contesto.
Acceleration and Motion in One Dimension
Introduction to Acceleration
Acceleration is a fundamental concept in physics that describes how the velocity of an object changes over time. It is a vector quantity, meaning it has both magnitude and direction. Understanding acceleration is essential for analyzing motion in one dimension.
Definition: Acceleration is the rate of change of velocity with respect to time.
Formula: , where is the change in velocity and is the change in time.
Units: The SI unit for acceleration is meters per second squared (m/s2).
Example: If a student walks to the right at a constant speed of 2.0 m/s for 2.0 s, the acceleration is zero because the velocity does not change.
Velocity-Time and Acceleration-Time Graphs
Graphs are useful tools for visualizing motion. The velocity-time (v-t) graph shows how velocity changes over time, while the acceleration-time (a-t) graph shows how acceleration changes.
Constant Velocity: The v-t graph is a horizontal line; the a-t graph is a line at zero.
Constant Acceleration: The v-t graph is a straight line with a slope equal to the acceleration; the a-t graph is a horizontal line at the value of the acceleration.
Example: For a car accelerating from rest, the v-t graph is a straight line starting at zero.
Comparing Accelerations: Sonic vs. Corvette
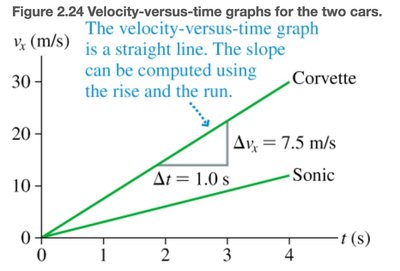
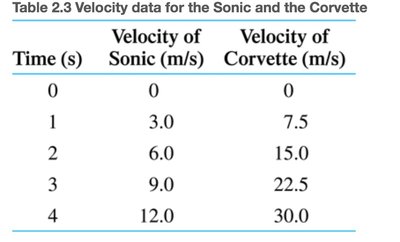
Different objects can have different accelerations depending on their change in velocity over time. Comparing the velocity-time graphs of two cars, such as Sonic and Corvette, illustrates this concept.
Largest Acceleration: The object with the steepest slope on the v-t graph has the largest acceleration.
Displacement: The area under the v-t graph represents the displacement.
Example: Corvette has a steeper slope than Sonic, indicating greater acceleration.


Acceleration in Real-World Contexts
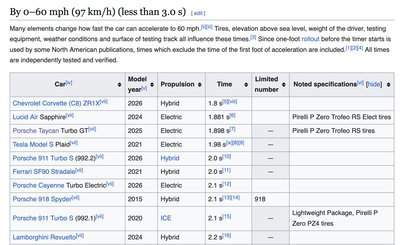
Acceleration is often discussed in the context of vehicles, such as the fastest production cars by their 0-60 mph times. This is a practical application of acceleration calculations.
0-60 mph Time: Measures how quickly a car can accelerate from rest to 60 mph.
Formula for Conversion: , where is the change in velocity (converted to m/s) and is the time taken.
Example: Corvette ZR1 accelerates from 0 to 60 mph in 1.8 seconds.

Positive and Negative Acceleration
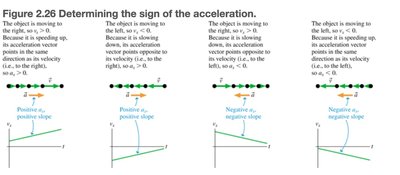
Acceleration can be positive or negative depending on the direction of velocity change. Positive acceleration means speeding up in the positive direction, while negative acceleration means slowing down or speeding up in the negative direction.
Positive Acceleration: Object speeds up in the positive direction or slows down in the negative direction.
Negative Acceleration: Object slows down in the positive direction or speeds up in the negative direction.
Zero Acceleration: Object moves at constant velocity.
Motion Diagrams and Graphs
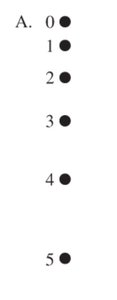
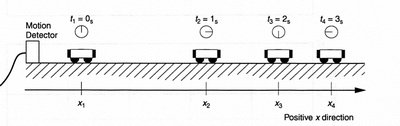
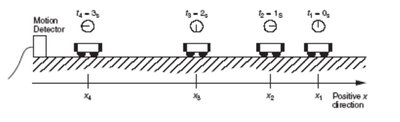
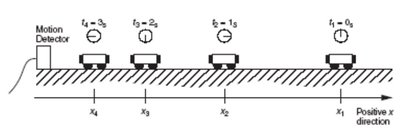
Motion diagrams visually represent the position of an object at different times. These diagrams help in understanding the nature of motion, such as speeding up, slowing down, or moving at constant speed.
Constant Speed: Equal spacing between positions.
Speeding Up: Increasing spacing between positions.
Slowing Down: Decreasing spacing between positions.
Calculating Acceleration in Different Scenarios
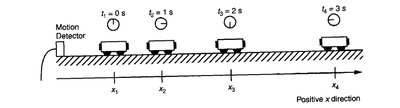
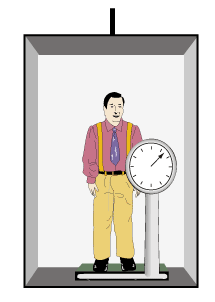
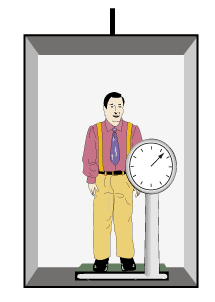
Acceleration can be calculated for various scenarios, such as a student changing speed or an elevator braking to a stop. The formula remains consistent across these cases.
Formula: , where is final velocity, is initial velocity, and is time.
Example: If a student changes speed from 2.0 m/s to 6.0 m/s in 2.0 s, m/s2.
Elevator Example: If an elevator slows from 10 m/s to 0 m/s in 4.0 s, m/s2.
Kinematic Equations for Constant Acceleration
Kinematic equations describe the motion of objects under constant acceleration. These equations are derived from the definitions of velocity and acceleration.
Graphical Interpretation of Displacement
The area under the velocity-time graph represents the displacement of an object. This area can be calculated as the sum of a rectangle and a triangle.
Rectangle: Area = initial velocity × time interval
Triangle: Area =
Total Displacement:

Summary Table: Velocity and Acceleration Signs
This table summarizes the signs of velocity and acceleration for different types of motion.
Speeding up to the right | Slowing down to the right | Speeding up to the left | Slowing down to the left | |
|---|---|---|---|---|
v | + | + | - | - |
a | + | - | - | + |
Motion with Constant Acceleration
When an object moves with constant acceleration, its velocity changes linearly, and its position changes quadratically over time.
Acceleration-Time Graph: Horizontal line
Velocity-Time Graph: Straight line
Position-Time Graph: Parabola

Tips for Success in Physics with Algebra
To excel in this course, students should attend lectures, complete homework, and ask questions regularly.
Show up to every lecture: Concepts build quickly and missing class can make it harder to follow.
Take homework seriously: Practice is essential for mastering material.
Ask questions early and often: Clarify confusion before exams.

Additional info: Some context and explanations were inferred from standard physics curriculum and textbook conventions to ensure completeness and clarity.
