 Indietro
Circular and Random Motion: Physics with Algebra Study Notes
Guida di studio - Note intelligenti
 Appunti personalizzati basati sui tuoi materiali, ampliati con definizioni chiave, esempi e contesto.
Circular and Random Motion
Introduction to Circular and Random Motion
Circular and random motion are fundamental concepts in physics that describe how objects move in predictable and unpredictable ways. Understanding these motions is essential for analyzing real-world phenomena, from the operation of centrifuges to the diffusion of molecules.
Circular Motion
Basic Concepts of Circular Motion
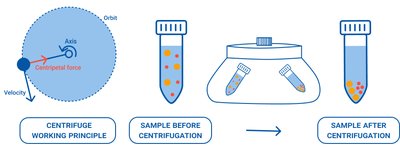
Circular motion occurs when an object moves along a circular path. The velocity of the object is always tangent to the circle, while the acceleration (centripetal acceleration) points toward the center of the circle. The force responsible for this acceleration is called the centripetal force.
Centripetal Force: The net force causing the inward acceleration of an object in circular motion.
Velocity: Always tangent to the circle at any point.
Acceleration: Directed toward the center of the circle.
Formula for Centripetal Acceleration:
where is the speed and is the radius of the circle.
Formula for Centripetal Force:
where is the mass of the object.
Application: Centrifuge
A centrifuge is a device that uses circular motion to separate substances of different densities. The denser particles move outward due to the centripetal force, allowing for separation from less dense substances.
Random Motion
Directed vs. Random Motion
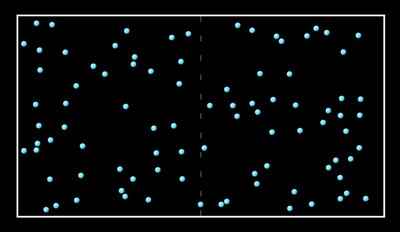
In physics, directed motion refers to movement in a specific direction, while random motion results from unpredictable collisions, such as those seen in diffusion.
Directed Motion: Predictable path, often due to a constant force.
Random Motion: Unpredictable path, often due to collisions with other particles.
Random Walk in One Dimension (1D)
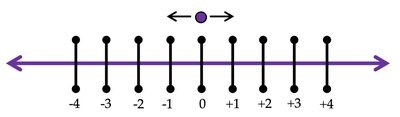
A random walk describes the path of a particle that moves in discrete steps, each with equal probability of moving left, right, or staying still. This model is fundamental for understanding diffusion and other stochastic processes.
At each time interval, the particle can move left, right, or stay in place.
The position after several steps is unpredictable for a single particle but follows a statistical pattern for many particles.
Counting Paths in a Random Walk
The number of possible paths to reach a certain position after a given number of steps can be calculated using combinatorics. For example, reaching after 3 steps involves counting all possible sequences of left, right, and stay moves that result in that position.
Random Walk with Multiple Particles: Plinko Model
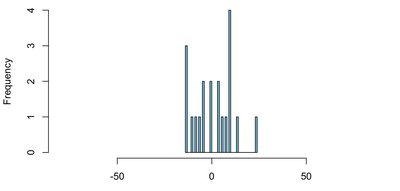
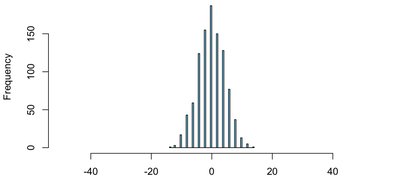
When multiple particles undergo random walks, their final positions form a distribution that can be visualized as a histogram. The Plinko board is a physical model that demonstrates this concept, where balls dropped through an array of pegs end up distributed around the center due to the large number of possible paths leading there.
Probability Distributions and Histograms
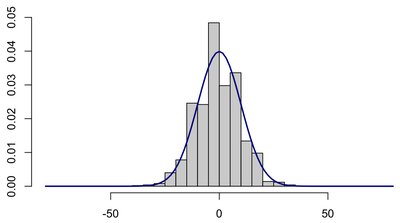
As the number of particles increases, the histogram of their final positions approaches a normal (Gaussian) distribution. The mean and spread of this distribution can be described using statistical quantities:
Mean (): The average final position of all particles.
Root-Mean-Square (RMS) or Standard Deviation (): Measures how spread out the positions are from the mean.
Formulas:
The RMS value is equivalent to the standard deviation for a symmetric distribution centered at zero.
Effect of Number of Particles and Steps
Increasing the number of particles makes the histogram smoother and more closely approximates the theoretical probability distribution. Increasing the number of steps increases the spread (standard deviation) of the distribution.
Number of Particles | Histogram Appearance |
|---|---|
20 | Jagged, less smooth |
100 | Smoother |
1000 | Very smooth, bell-shaped |
Number of Steps | Spread of Distribution |
|---|---|
20 | Narrow |
50 | Wider |
100 | Widest |
Describing Histograms: Mean and RMS
The mean of the histogram represents the average final position, which is approximately zero for a symmetric random walk. The RMS (or standard deviation) quantifies the typical distance from the mean.
Theoretical Probability Distribution
For a large number of steps and particles, the probability of finding a particle at position is given by:
This is the equation for a normal (Gaussian) distribution.
Root-Mean-Square (RMS) Distance and Diffusion
Diffusion and RMS Distance
Diffusion describes the process by which particles spread from regions of high concentration to low concentration due to random motion. The RMS distance traveled by a diffusing particle after time is given by:
where is the diffusion constant, which depends on the particle and the medium.
Diffusion Constant (): Characteristic of the particle and medium (e.g., air, water).
Diffusion in Higher Dimensions
In 2D:
In 3D:
The RMS distance increases with the square root of time, indicating that diffusion is a slow process over long distances.
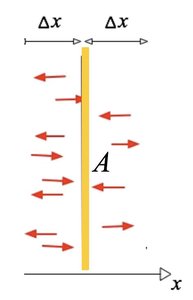
Diffusion Across a Membrane
When there is a concentration difference across a membrane, more particles move from the region of higher concentration to lower concentration, resulting in net diffusion.
Summary Table: Models for Motion
Lecture | Type of Motion | Description |
|---|---|---|
L4 | Directed motion with constant acceleration | Predictable, straight-line motion under constant force |
L5 | Directed motion with non-constant acceleration | Predictable, but acceleration changes with time |
L6 | Random motion | Unpredictable, modeled statistically |
Core Physics Ideas
Rate:
Final Value:
