 Indietro
Introduction to Motion: Math Review, Unit Conversion, and Describing Motion
Guida di studio - Note intelligenti
 Appunti personalizzati basati sui tuoi materiali, ampliati con definizioni chiave, esempi e contesto.
Math Review
Understanding Slope and Proportionality
In physics, the concept of slope is essential for interpreting graphs and understanding relationships between variables. Slope describes how one variable changes in relation to another and is foundational for analyzing motion.
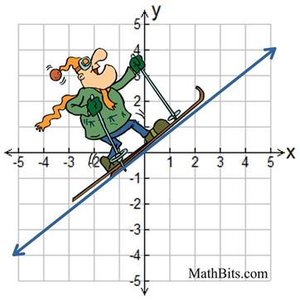
Positive Slope (Direct Proportion): As one variable increases, the other also increases. This is represented mathematically as .
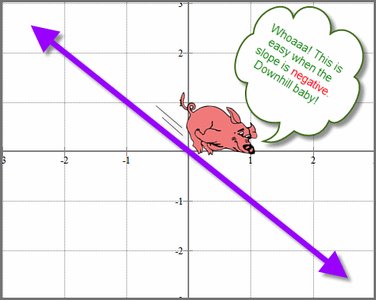
Negative Slope (Inverse Proportion): As one variable increases, the other decreases.
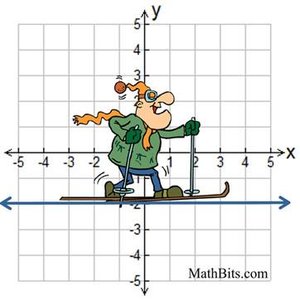
Zero Slope: The dependent variable remains constant as the independent variable changes.
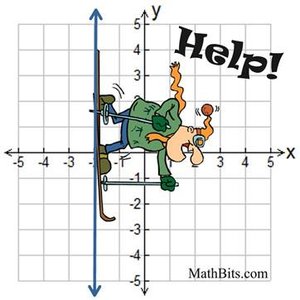
Undefined Slope: The independent variable remains constant while the dependent variable changes.
Parabola: A quadratic relationship, such as , often appears in accelerated motion.
Unit Conversion
Converting Between Units
Physics problems often require converting between different units. The conversion process uses ratios that equal one, allowing you to change units without altering the value of a measurement.
General Formula:
Example 1: Convert 5 km to meters:
Example 2: Convert 165 lbs to kg:
Example 3: Convert 50 km/h to m/s:
Describing Linear Motion
Key Quantities in Motion
To describe motion, we use several fundamental quantities:
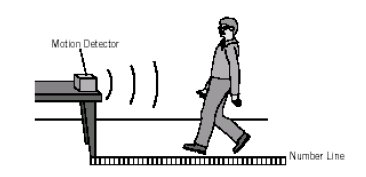
Position (x): The location of an object relative to a reference point.
Time (t): The ongoing sequence of events taking place.
Velocity (v): The rate of change of position with respect to time.

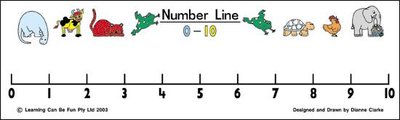
Reference Point
A reference point is a fixed place used to determine the position of an object. All positions are measured relative to this point.
Position-Time Graphs
Interpreting Position-Time (x-t) Graphs
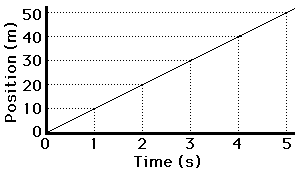
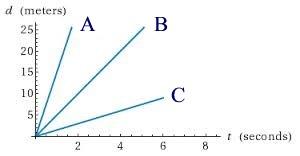
Position-time graphs are used to visualize how an object's position changes over time. The slope of the line on a position-time graph represents the object's speed.
Steady Pace: A straight line indicates constant speed.
Slope Calculation:
Defining Speed
Average Speed
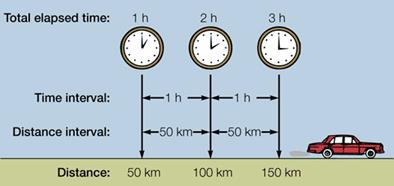
Speed is a scalar quantity that measures how fast an object is moving, regardless of direction.
Formula:
Symbolic Form:
Comparing Speeds
On a position-time graph, the steeper the slope, the greater the speed.
Vectors and Scalars
Definitions and Examples
Physical quantities can be classified as either scalars or vectors:
Scalar: Described by magnitude only (e.g., speed, distance, mass).
Vector: Described by both magnitude and direction (e.g., velocity, displacement, force).
Direction: Can be specified using compass directions or positive/negative signs according to the Cartesian coordinate system.
Examples:
15 m/s (scalar)
15 m/s east (vector)
30 m/s west (vector)
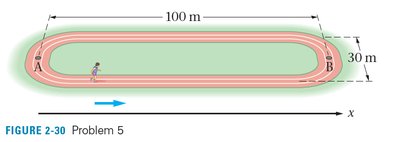
Distance vs. Displacement
Key Differences
Distance and displacement are both measures of length, but they have important differences:
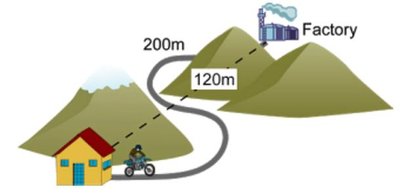
Distance: The total length of the path traveled (scalar).
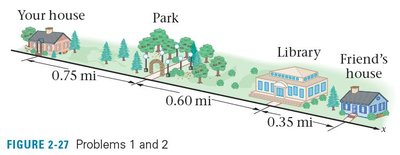
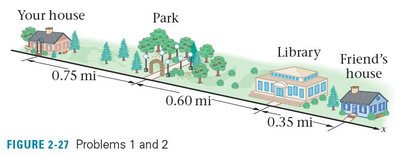
Displacement: The straight-line distance from the starting point to the ending point, with direction (vector).
Formulas
Displacement:
Distance: Add the lengths of all segments traveled, regardless of direction.
Example: Jason walks 3 meters east, then 8 meters west. Distance = 3 m + 8 m = 11 m. Displacement = -5 m (since he ends up 5 m west of his starting point).
Speed vs. Velocity
Comparing Scalar and Vector Quantities
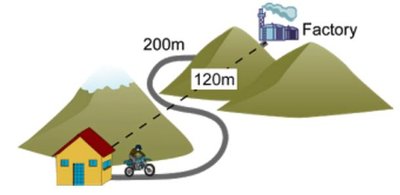
Speed and velocity both describe how fast an object moves, but velocity also includes direction.
Speed: (scalar)
Velocity: (vector)
Velocity Formula
Units: m/s, km/h
Problem Solving Examples
Sample Problems
Example 1: What is the average speed in km/h for a car that travels 50.0 km in 40.0 min?
Example 2: Suppose a radio signal travels from Earth at a speed of m/s. How far does it travel in 20.0 min?
Example 3: If the Sun is km from Earth, how long does it take sunlight to reach Earth if light moves at m/s?
Solution Steps:
Identify known values and what is being asked.
Convert units if necessary.
Apply the appropriate formula.
Solve and check units.
Summary Table: Scalar vs. Vector Quantities
Quantity | Scalar or Vector | Example |
|---|---|---|
Distance | Scalar | 5 m |
Displacement | Vector | 5 m east |
Speed | Scalar | 10 m/s |
Velocity | Vector | 10 m/s north |
Additional info: These foundational concepts are essential for understanding all subsequent topics in kinematics and dynamics in Physics with Algebra.
