 Indietro
Kinematics and Projectile Motion: Graphs and Concepts
Guida di studio - Note intelligenti
 Appunti personalizzati basati sui tuoi materiali, ampliati con definizioni chiave, esempi e contesto.
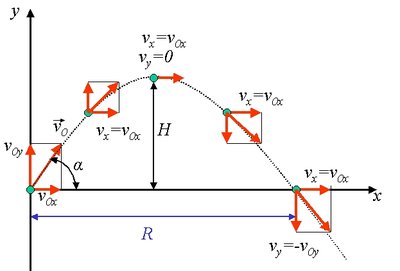
Q1. Analyze the motion of a projectile as shown in the diagram. What are the key features of its velocity components at different points along its path?
Background
Topic: Projectile Motion
This question tests your understanding of two-dimensional motion, specifically how the horizontal and vertical components of velocity change for a projectile under gravity.
Key Terms and Formulas:
Projectile motion: The motion of an object thrown or projected into the air, subject only to acceleration due to gravity.
Horizontal velocity (): (remains constant)
Vertical velocity (): (changes due to gravity)
At the peak:
Range ():
Maximum height ():
Step-by-Step Guidance
Identify the initial velocity components: Use and .
Recall that the horizontal velocity remains constant throughout the flight (no horizontal acceleration).
The vertical velocity decreases as the projectile rises, becomes zero at the peak, and increases in magnitude (but negative) as it falls back down.
At the peak of the trajectory, the vertical component of velocity is zero, but the horizontal component is unchanged.
Think about how the velocity vectors at different points (start, peak, end) relate to the initial components and the effect of gravity.
Try solving on your own before revealing the answer!
Final Answer:
At launch, the projectile has both horizontal () and vertical () velocity components. As it rises, decreases due to gravity, reaching zero at the peak. The horizontal component remains constant throughout. After the peak, becomes negative (downward), increasing in magnitude until it lands, where and .
This demonstrates the independence of horizontal and vertical motions in projectile motion.
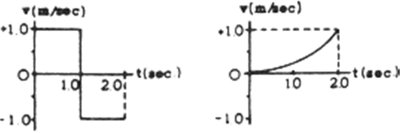
Q2. The graphs below show velocity versus time for two different motions. Describe the acceleration for each case.
Background
Topic: Kinematics – Velocity-Time Graphs
This question tests your ability to interpret velocity-time graphs and relate them to acceleration.
Key Terms and Formulas:
Acceleration (): The rate of change of velocity with respect to time, .
On a velocity-time graph, the slope at any point gives the acceleration.
Step-by-Step Guidance
For the left graph: Notice the velocity changes abruptly from +1 to -1 m/s at s, and back to 0 at s.
For the right graph: The velocity increases smoothly from 0 to +1 m/s over 2 seconds.
Think about what kind of acceleration (constant, zero, or changing) would produce each graph.
Consider the slope of each segment: a steep, sudden change means a large (possibly infinite) acceleration; a curved line means changing acceleration.
Try solving on your own before revealing the answer!
Final Answer:
For the left graph, the acceleration is not constant; it is undefined (infinite) at the points where the velocity jumps instantaneously. For the right graph, the velocity increases smoothly, indicating a positive, increasing acceleration (the slope is increasing).
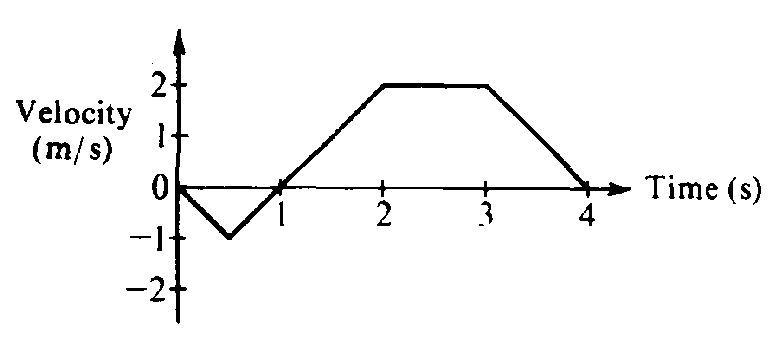
Q3. The graph below shows velocity versus time for an object. Describe the motion and determine when the object is at rest.
Background
Topic: Interpreting Velocity-Time Graphs
This question tests your ability to read a velocity-time graph and understand when the object changes direction or is at rest.
Key Terms and Formulas:
Velocity (): The rate of change of position with time.
At rest:
Positive velocity: moving in the positive direction; negative velocity: moving in the negative direction.
Step-by-Step Guidance
Identify the points where the velocity crosses the time axis (). These are the moments when the object is at rest or changes direction.
Note the intervals where velocity is positive (object moves forward) and where it is negative (object moves backward).
Look for flat segments (constant velocity) and sloped segments (changing velocity, i.e., acceleration).
Mark the times at which to answer when the object is at rest.
Try solving on your own before revealing the answer!
Final Answer:
The object is at rest at the points where the graph crosses the time axis (at , s, and s). The object changes direction at s. The motion consists of intervals of negative, then positive, then constant, then negative velocity.
