 Indietro
Ch 2 Motion in One Dimension: Study Notes
Guida di studio - Note intelligenti
 Appunti personalizzati basati sui tuoi materiali, ampliati con definizioni chiave, esempi e contesto.
Motion in One Dimension
Introduction to Linear Motion
One-dimensional motion refers to the movement of objects along a straight line, either horizontally or vertically. This chapter introduces the concepts of position, velocity, and acceleration, and how they are represented graphically and mathematically.
Describing Motion
Position and Coordinate Systems
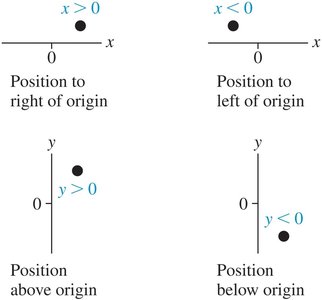
Position describes the location of an object relative to a chosen origin and axis. The x-axis is used for horizontal motion, and the y-axis for vertical motion. Positive and negative values indicate direction relative to the origin.
Position (x or y): The location of an object along a straight line.
Origin: The reference point (x = 0 or y = 0).
Direction: Positive values are to the right (x) or above (y); negative values are to the left (x) or below (y).
Motion Diagrams and Position-Time Graphs
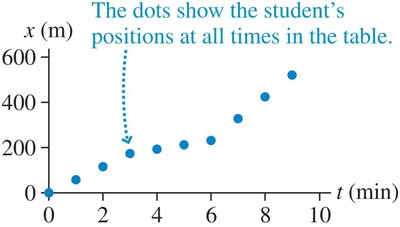
Motion diagrams use dots to represent an object's position at equal time intervals. Position-time graphs plot position (x) versus time (t), showing how an object's position changes over time.

Interpreting Position-Time Graphs
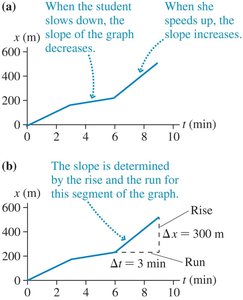
Slope: The slope of the position-time graph at any point gives the object's velocity at that instant.
Steeper Slope: Indicates faster speed.
Positive Slope: Motion in the positive direction.
Negative Slope: Motion in the negative direction.
Velocity
Average and Instantaneous Velocity
Velocity is the rate of change of position with respect to time, including direction. The average velocity over a time interval is given by:
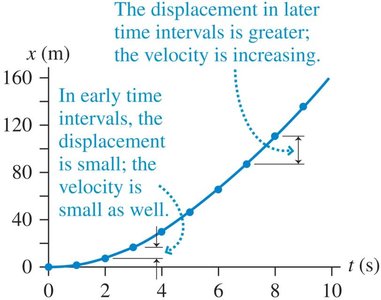
The instantaneous velocity is the velocity at a specific instant, found as the slope of the tangent to the position-time curve at that point.
Velocity-Time Graphs
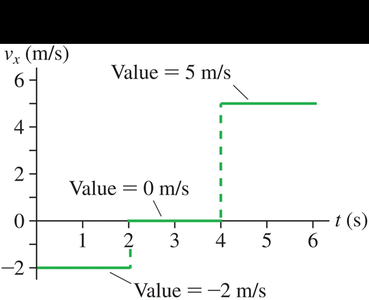
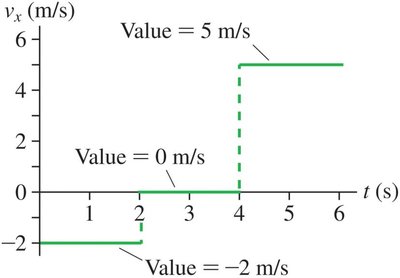
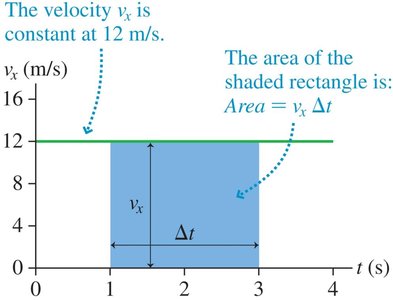
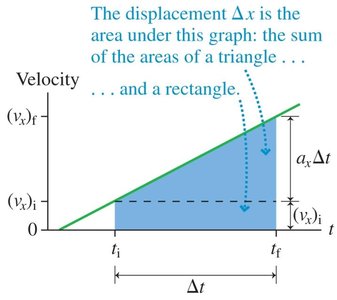
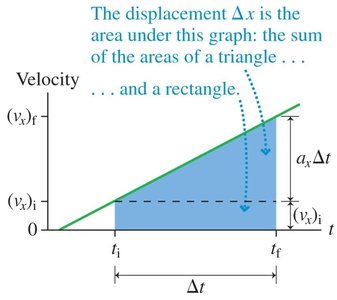
Velocity-time graphs plot velocity (v) versus time (t). The area under the velocity-time graph represents the object's displacement.
Example: Finding Velocity from Position Graph
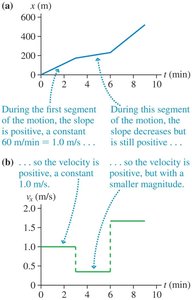
Calculate the slope of each segment of the position-time graph to find velocity.
Constant slope = constant velocity; zero slope = object at rest.
Uniform Motion
Definition and Representation
Uniform motion means equal displacements occur in equal time intervals—velocity is constant. The position-time graph is a straight line, and the velocity-time graph is a horizontal line.
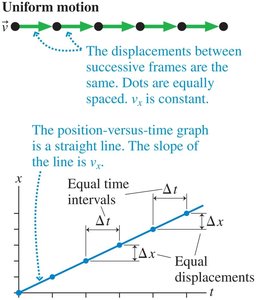
The equation for uniform motion is:
Proportional Relationships
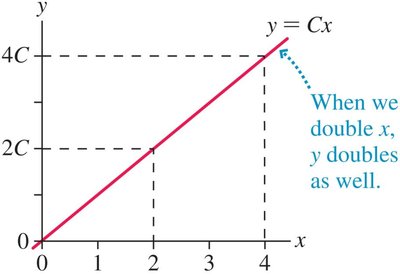
If , then y is proportional to x. The graph is a straight line through the origin.
Displacement from Velocity Graphs
Area Under the Curve
The displacement is equal to the area under the velocity-time graph during the time interval .
Instantaneous Velocity
Definition and Graphical Interpretation
The instantaneous velocity is the velocity at a specific instant. It is found as the slope of the tangent to the position-time curve at that point.
Acceleration
Definition and Units
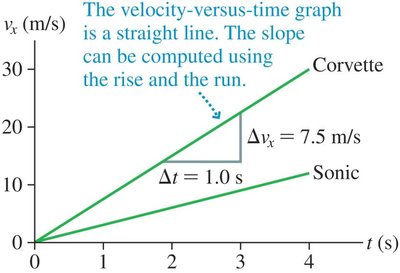
Acceleration is the rate of change of velocity with respect to time. It is given by:
The SI unit of acceleration is meters per second squared (m/s2).
Velocity and Acceleration Graphs
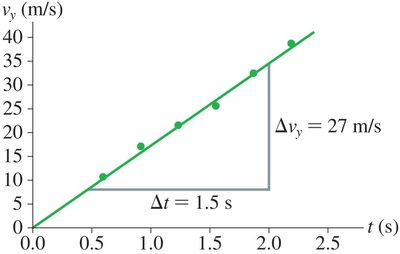
The slope of a velocity-time graph gives the acceleration. For constant acceleration, the velocity-time graph is a straight line.
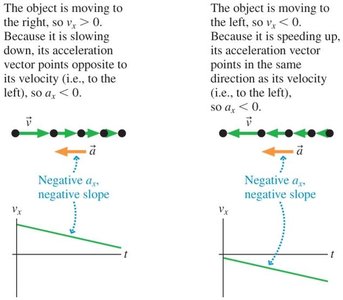
Sign of Acceleration
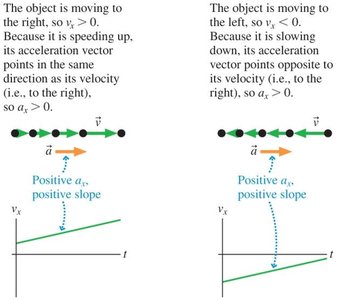
The sign of acceleration depends on the direction of motion and whether the object is speeding up or slowing down. If velocity and acceleration have the same sign, the object speeds up; if opposite, it slows down.
Motion with Constant Acceleration
Kinematic Equations
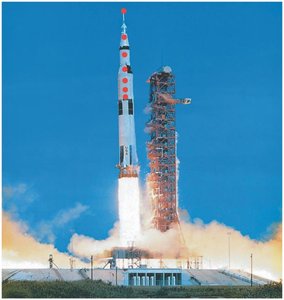
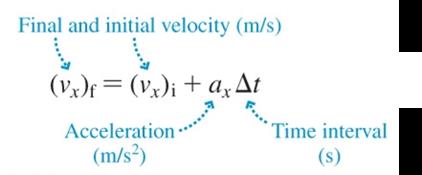
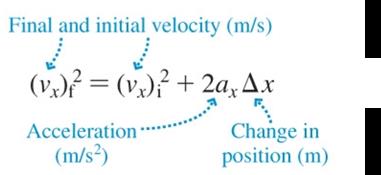
For motion with constant acceleration, the following equations apply:
Quadratic Relationships
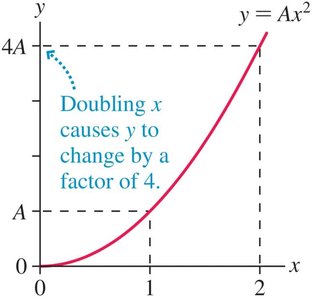
When position depends on the square of time, the relationship is quadratic. The graph is a parabola.
Free Fall
Definition and Properties
Free fall is the motion of an object under the influence of gravity alone. All objects in free fall near Earth's surface have the same acceleration, , directed downward.
Free-fall acceleration is always downward, regardless of the object's motion direction.
Use kinematic equations with for vertical motion.
Summary of Key Concepts
Velocity:
Acceleration:
Uniform motion: Constant velocity, straight-line position-time graph.
Constant acceleration: Linear velocity-time graph, parabolic position-time graph.
Free fall: Special case of constant acceleration, downward.
