 Indietro
Representing Motion with Graphs: Slope and Area Models in Kinematics
Guida di studio - Note intelligenti
 Appunti personalizzati basati sui tuoi materiali, ampliati con definizioni chiave, esempi e contesto.
Representing Motion in Physics
Introduction to Graphical Models
Understanding motion in physics often involves interpreting and analyzing graphs. The two primary models used are the slope model and the area model. These models help us extract physical quantities such as velocity, acceleration, and displacement from position, velocity, and acceleration graphs.
Slope Model in Kinematics
Position vs. Time Graphs
Position vs. Time graphs display how an object's position changes over time. The slope of the graph at any point represents the object's velocity.
Key Point 1: Velocity is the slope of the position vs. time graph. It is calculated as the change in position divided by the change in time:
Key Point 2: A constant slope indicates constant velocity, while a changing slope indicates acceleration.
Key Point 3: The sign of the slope (positive or negative) indicates the direction of motion.
Key Point 4: A zero slope (horizontal line) means the object is at rest.
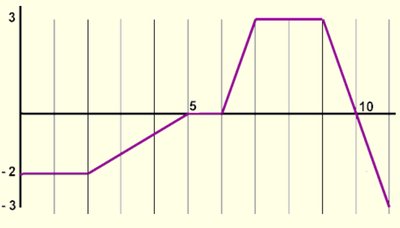
Example: Consider the graph below. The slope from t = 0 to t = 10 s gives the velocity during that interval. A positive slope means the object is moving forward, while a negative slope means it is moving backward.
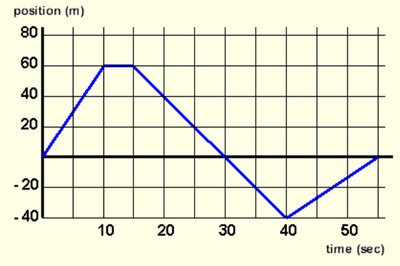
Interpreting Position vs. Time Graphs
Different shapes of position vs. time graphs correspond to different types of motion:
Straight, upward-sloping line: Constant positive velocity.
Straight, downward-sloping line: Constant negative velocity.
Curved line (concave up): Increasing velocity (positive acceleration).
Curved line (concave down): Decreasing velocity (negative acceleration).
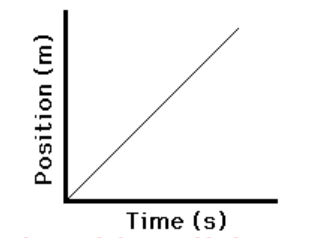
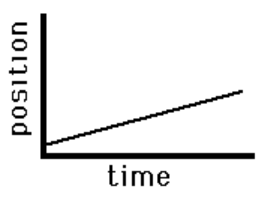
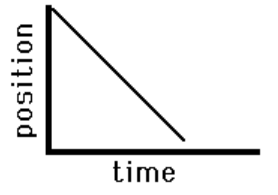
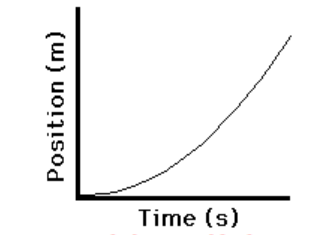
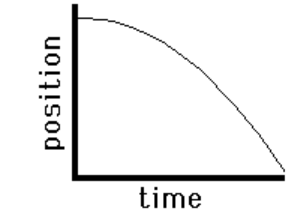
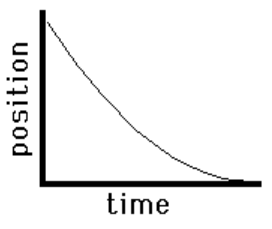
Explaining Motion from Position vs. Time Graphs
To describe the motion, analyze the slope in each time interval:
Positive slope: Object moves in the positive direction.
Negative slope: Object moves in the negative direction.
Zero slope: Object is stationary.
Changing slope: Object is accelerating or decelerating.
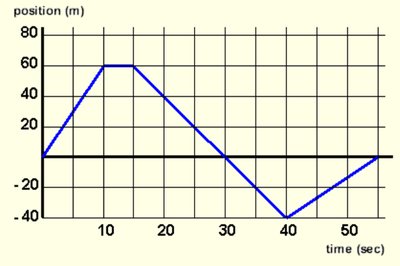
Slope Model: Velocity vs. Time Graphs
Finding Acceleration
On a velocity vs. time graph, the slope represents the object's acceleration:
Key Point 1: Acceleration is the slope of the velocity vs. time graph:
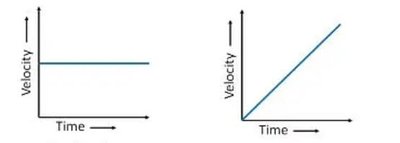
Key Point 2: A constant slope means constant acceleration.
Key Point 3: A zero slope (horizontal line) means constant velocity (zero acceleration).
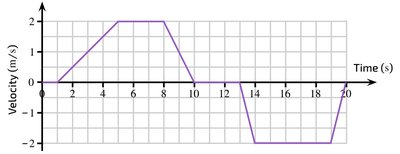
Example: The graph below can be used to calculate acceleration over different intervals by finding the slope between two points.
Explaining Motion from Velocity vs. Time Graphs
Interpret the graph by analyzing the slope and the value of velocity:
Positive velocity above the axis: Object moves forward.
Negative velocity below the axis: Object moves backward.
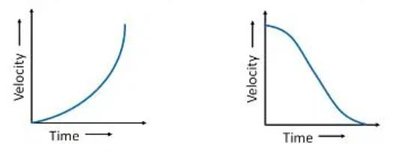
Positive slope: Increasing velocity (positive acceleration).
Negative slope: Decreasing velocity (negative acceleration).
Zero slope: Constant velocity.
Area Model in Kinematics
Area Under Velocity vs. Time Graphs
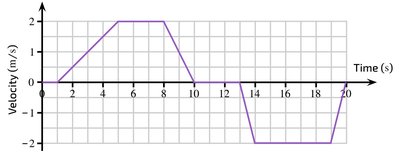
The area under a velocity vs. time graph represents the object's displacement. This is because multiplying velocity (height) by time (base) gives displacement:
Rectangle area:
Triangle area:
Displacement:
Example: Calculate the area under the curve between two times to find the displacement.
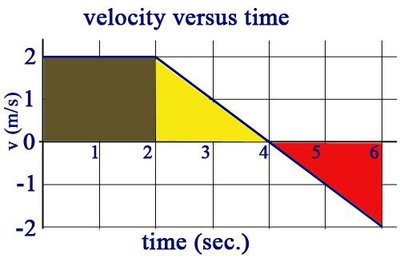
Area Under Acceleration vs. Time Graphs
The area under an acceleration vs. time graph gives the change in velocity:
Change in velocity:
Example: For a race car accelerating, the area under the acceleration-time graph from to gives the total change in velocity during that interval.
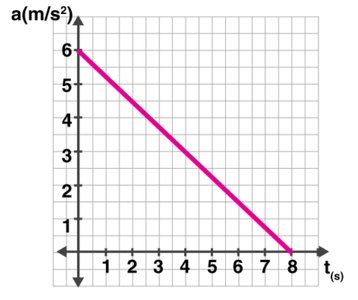
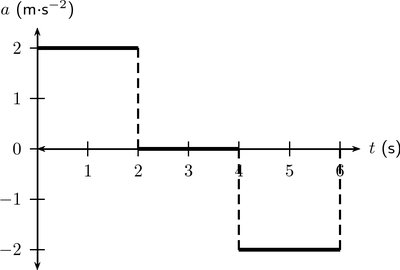
Summary of Motion Graphs
Types of Motion Graphs
Displacement (Position) vs. Time
Velocity vs. Time
Acceleration vs. Time
Two Basic Graph Models
Slope Model: Slope gives velocity (from position-time) or acceleration (from velocity-time).
Area Model: Area gives displacement (from velocity-time) or change in velocity (from acceleration-time).
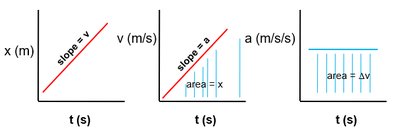
Comparing and Sketching Graphs
Translating Between Graph Types
Given one type of motion graph, you can sketch the corresponding graph of another quantity by analyzing slopes and areas:
Constant positive slope (position-time): Translates to a horizontal line (constant velocity) on a velocity-time graph.
Increasing slope (position-time): Translates to a rising line (positive acceleration) on a velocity-time graph.
Zero slope (position-time): Translates to a velocity of zero.
Practice by matching segments of one graph to the corresponding features in another.
Practice and Application
Check for Understanding
Identify intervals of positive, negative, or zero velocity from position-time graphs.
Calculate velocity or acceleration from the slope of the graph.
Calculate displacement or change in velocity from the area under the curve.
Draw corresponding acceleration-time graphs from velocity-time graphs and vice versa.
Key Equations
Average velocity:
Average acceleration:
Displacement from velocity-time graph: (area under curve)
Change in velocity from acceleration-time graph: (area under curve)
Additional info: These concepts are foundational for all further study in kinematics and dynamics, including projectile motion, forces, and energy analysis.
