 Indietro
Physics with Calculus: Kinematics, Graphs, and Proportionality Study Guide
Guida di studio - Note intelligenti
 Appunti personalizzati basati sui tuoi materiali, ampliati con definizioni chiave, esempi e contesto.
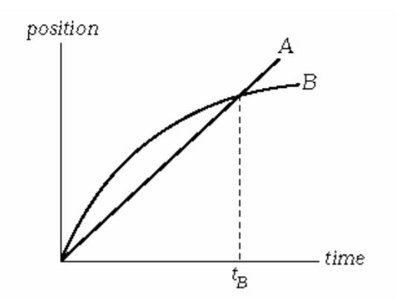
Q1. The graph below shows the position as a function of time for two trains running on parallel tracks. Which of the following statements is true?
Background
Topic: Kinematics – Position vs. Time Graphs
This question tests your understanding of how to interpret position vs. time graphs, specifically how to compare velocities and accelerations of two objects based on the slopes and curvature of their position-time plots.
Key Terms and Formulas:
Velocity (): The slope of the position vs. time graph at any point.
Acceleration (): The rate of change of velocity, or the curvature (second derivative) of the position vs. time graph.
Step-by-Step Guidance
Examine the slopes of both curves at various points. The slope at any point gives the velocity of the train at that instant.
At time , compare the slopes of the two curves. Are they equal or different? This will help you determine if the trains have the same velocity at $t_B$.
Look for any point before where the slopes of both curves are equal. This would indicate that the trains have the same velocity at that instant.
Consider the curvature of each graph to compare accelerations. If one graph is a straight line and the other is curved, their accelerations are different.
Try solving on your own before revealing the answer!
Final Answer: C. Both trains have the same velocity at some time before .
At some point before , the slopes of the two position-time graphs are equal, indicating that the trains have the same velocity at that instant. The other statements are incorrect based on the analysis of the slopes and curvature.
