
Ch. 44 - Astrophysics and Cosmology
Giancoli Douglas - Physics for Scientists and Engineers 5th edition
Giancoli Douglas5th editionPhysics for Scientists and EngineersISBN: 9780137488179Non è quello che usi tu?Cambia libro di testo
Capitolo 39, Problema 16

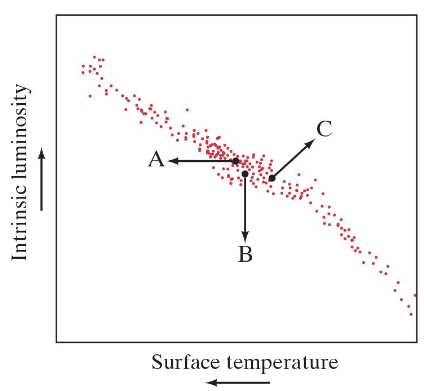
(II) Suppose that three main-sequence stars could undergo the three changes represented by the three arrows, A, B, and C, in the H–R diagram of Fig. 44–35. For each case, describe the changes in temperature, intrinsic luminosity, and size.

Guida verificata passo dopo passo
1
Step 1: Understand the Hertzsprung-Russell (H-R) diagram. The H-R diagram plots stars based on their temperature (x-axis, decreasing from left to right) and intrinsic luminosity (y-axis, increasing upward). The size of a star can be inferred from its position on the diagram, as larger stars tend to be more luminous for a given temperature.
Step 2: Analyze arrow A. If a star moves horizontally to the right on the H-R diagram, its temperature decreases (cooler star), while its intrinsic luminosity remains constant. Since luminosity depends on both temperature and size, the star's size must increase to compensate for the lower temperature.
Step 3: Analyze arrow B. If a star moves vertically upward on the H-R diagram, its intrinsic luminosity increases, while its temperature remains constant. This implies the star's size must increase significantly to produce the higher luminosity at the same temperature.
Step 4: Analyze arrow C. If a star moves diagonally downward to the right, both its temperature decreases and its intrinsic luminosity decreases. This suggests the star is becoming cooler and less luminous, which typically corresponds to a decrease in size.
Step 5: Summarize the changes for each arrow. Arrow A represents a cooler, larger star with constant luminosity. Arrow B represents a larger, more luminous star with constant temperature. Arrow C represents a cooler, smaller, and less luminous star.

Risposta video verificata per un problema simile:

Questa soluzione video è stata consigliata dai nostri tutor come utile per risolvere questo problema.
Durata del video:
5m

Concetti chiave

Ecco i concetti essenziali che devi comprendere per rispondere correttamente alla domanda.

Hertzsprung-Russell (H–R) Diagram

The H–R diagram is a scatter plot that shows the relationship between the luminosity and temperature of stars. It categorizes stars into different groups, such as main-sequence stars, giants, and white dwarfs, based on their brightness and surface temperature. Understanding this diagram is crucial for analyzing stellar evolution and the changes that stars undergo over time.
Video consigliato:
Percorso guidato
12:04
Ray Diagrams for Concave Mirrors

Stellar Evolution

Stellar evolution refers to the life cycle of a star, from its formation to its eventual death. Main-sequence stars, like our Sun, undergo changes in temperature, luminosity, and size as they exhaust their nuclear fuel. These changes can be represented by arrows on the H–R diagram, indicating the star's transition through different stages, such as becoming a red giant or a white dwarf.
Video consigliato:

Intrinsic Luminosity

Intrinsic luminosity is the total amount of energy emitted by a star per unit time, independent of its distance from the observer. It is a fundamental property of stars that helps classify them and understand their evolutionary stages. Changes in intrinsic luminosity during stellar evolution can indicate the star's current phase, such as whether it is expanding into a giant or contracting into a white dwarf.
Video consigliato:
Percorso guidato
06:50
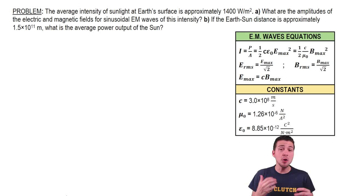
Intensity of EM Waves Example 1