Ch 02: Kinematics in One Dimension
Knight Calc - Physics for Scientists and Engineers 5th Edition
Knight Calc5th EditionPhysics for Scientists and EngineersISBN: 9780137344796Non è quello che usi tu?Cambia libro di testo
Capitolo 2, Problema 18b

FIGURE EX1.18 shows the motion diagram of a drag racer. The camera took one frame every 2 s. Make a position-versus-time graph for the drag racer. Because you have data only at certain instants, your graph should consist of dots that are not connected together.

Guida verificata passo dopo passo
1
Step 1: Analyze the motion diagram provided in FIGURE EX1.18. Identify the positions of the drag racer at each time interval. Note that the camera captures a frame every 2 seconds, so the time intervals are t = 0 s, t = 2 s, t = 4 s, and so on.
Step 2: Record the position of the drag racer at each time interval. This information can be extracted from the motion diagram by observing the spacing between the dots, which represent the drag racer's position at each frame.
Step 3: Create a table with two columns: one for time (in seconds) and one for position (in meters). Fill in the table with the time values (e.g., 0 s, 2 s, 4 s, etc.) and the corresponding positions from the motion diagram.
Step 4: Plot the data points from the table onto a position-versus-time graph. Place time (t) on the horizontal axis and position (x) on the vertical axis. For each time value, plot a dot at the corresponding position value.
Step 5: Ensure that the graph consists only of dots and that the dots are not connected. Label the axes appropriately, with 'Time (s)' on the x-axis and 'Position (m)' on the y-axis, and include a title for the graph, such as 'Position vs. Time for Drag Racer.'

Risposta video verificata per un problema simile:

Questa soluzione video è stata consigliata dai nostri tutor come utile per risolvere questo problema.
Durata del video:
5m

Concetti chiave

Ecco i concetti essenziali che devi comprendere per rispondere correttamente alla domanda.

Position vs. Time Graphs

A position vs. time graph visually represents an object's position at various times during its motion. The x-axis typically represents time, while the y-axis represents position. In this case, the graph will consist of discrete points indicating the position of the drag racer at each 2-second interval, rather than a continuous line, reflecting the data collection method.
Video consigliato:
Percorso guidato
03:04
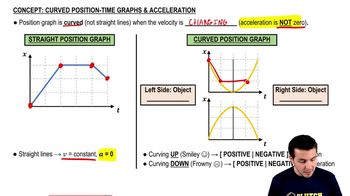
Curved Position-Time Graphs & Acceleration

Motion Diagrams

Motion diagrams are visual representations that illustrate an object's position at specific time intervals. They help in understanding the object's motion by showing how its position changes over time. In the context of the drag racer, the motion diagram provides the necessary data points to plot the position vs. time graph.
Video consigliato:
Percorso guidato
08:07
Work and PV Diagrams

Discrete Data Points

Discrete data points refer to individual measurements taken at specific intervals, rather than continuous data. In this scenario, the drag racer's position is recorded every 2 seconds, resulting in distinct points on the graph. This approach is essential for accurately representing the motion of the racer based on the available data.
Video consigliato:
Percorso guidato
08:35
Angular Momentum of a Point Mass