
Ch 02: Kinematics in One Dimension
Knight Calc - Physics for Scientists and Engineers 5th Edition
Knight Calc5th EditionPhysics for Scientists and EngineersISBN: 9780137344796Non è quello che usi tu?Cambia libro di testo
Capitolo 2, Problema 5a

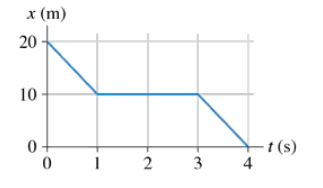
FIGURE EX2.5 shows the position graph of a particle. Draw the particle’s velocity graph for the interval .

Guida verificata passo dopo passo
1
Analyze the position vs. time graph provided in the problem. Identify the key features such as slopes (positive, negative, or zero) and any changes in the slope, as these correspond to the velocity of the particle.
Recall that the velocity of a particle is the derivative of its position with respect to time, \( v(t) = \frac{dx}{dt} \). The slope of the position graph at any point gives the velocity at that time.
Break the position graph into segments where the slope is constant or changes. For each segment, determine whether the slope is positive (indicating positive velocity), negative (indicating negative velocity), or zero (indicating zero velocity).
Plot the velocity graph based on the slopes of the position graph. For example, if the slope of the position graph is constant and positive, the velocity graph will show a horizontal line at a positive value. If the slope is zero, the velocity graph will show a horizontal line at zero.
Ensure that the transitions in the velocity graph correspond to the changes in slope of the position graph. For instance, if the slope of the position graph changes abruptly, the velocity graph will show a discontinuity at that point.

Risposta video verificata per un problema simile:

Questa soluzione video è stata consigliata dai nostri tutor come utile per risolvere questo problema.
Durata del video:
5m

Concetti chiave

Ecco i concetti essenziali che devi comprendere per rispondere correttamente alla domanda.

Position vs. Time Graphs

A position vs. time graph illustrates how the position of a particle changes over time. The slope of this graph at any point represents the velocity of the particle. A steeper slope indicates a higher velocity, while a flat slope indicates the particle is at rest. Understanding this relationship is crucial for interpreting how the particle moves.
Video consigliato:
Percorso guidato
03:04
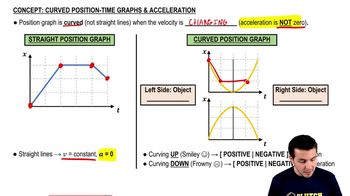
Curved Position-Time Graphs & Acceleration

Velocity

Velocity is a vector quantity that describes the rate of change of an object's position with respect to time. It has both magnitude and direction, distinguishing it from speed, which is scalar. The velocity graph can be derived from the position graph by calculating the slope of the position curve at various points, indicating how quickly and in which direction the particle is moving.
Video consigliato:
Percorso guidato
7:27
Escape Velocity

Graphical Interpretation

Graphical interpretation involves analyzing graphs to extract meaningful information about physical phenomena. In this context, converting a position graph to a velocity graph requires understanding how to represent changes in position as changes in velocity over time. This skill is essential for visualizing motion and predicting future behavior of the particle based on its current state.
Video consigliato:
Percorso guidato
05:06
Adding Vectors Graphically