Ch 05: Force and Motion
Knight Calc - Physics for Scientists and Engineers 5th Edition
Knight Calc5th EditionPhysics for Scientists and EngineersISBN: 9780137344796Non è quello che usi tu?Cambia libro di testo
Capitolo 5, Problema 32

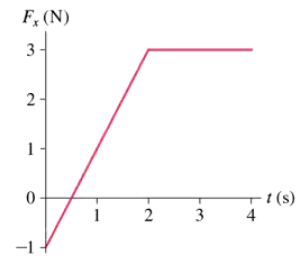
A single force with x-component Fₓ acts on a 2.0 kg object as it moves along the x-axis. A graph of Fₓ versus t is shown in FIGURE P5.32. Draw an acceleration graph aₓ versus t) for this object.

Guida verificata passo dopo passo
1
Step 1: Recall Newton's Second Law of Motion, which states that the net force acting on an object is equal to the product of its mass and acceleration: F = ma. Rearrange this equation to solve for acceleration: a = F/m.
Step 2: Identify the mass of the object from the problem statement. The mass is given as 2.0 kg. This will remain constant throughout the problem.
Step 3: Analyze the graph of Fₓ versus t. For each time interval, determine the value of Fₓ from the graph.
Step 4: For each time interval, calculate the acceleration aₓ using the formula aₓ = Fₓ / m. Substitute the values of Fₓ from the graph and the mass (2.0 kg) into the equation.
Step 5: Plot the calculated acceleration values aₓ against time t to create the acceleration graph. Ensure the graph reflects the changes in Fₓ over time as shown in the original force graph.

Risposta video verificata per un problema simile:

Questa soluzione video è stata consigliata dai nostri tutor come utile per risolvere questo problema.
Durata del video:
7m

Concetti chiave

Ecco i concetti essenziali che devi comprendere per rispondere correttamente alla domanda.

Newton's Second Law of Motion

Newton's Second Law states that the acceleration of an object is directly proportional to the net force acting on it and inversely proportional to its mass. This relationship is expressed mathematically as F = ma, where F is the net force, m is the mass, and a is the acceleration. In this scenario, understanding this law is crucial for determining how the force Fₓ affects the acceleration of the 2.0 kg object.
Video consigliato:
Percorso guidato
06:54
Intro to Forces & Newton's Second Law

Force vs. Time Graph

A force vs. time graph illustrates how the force acting on an object changes over time. The area under the curve of this graph represents the impulse, which is the change in momentum of the object. By analyzing the shape and values of the Fₓ versus t graph, one can derive the corresponding acceleration graph aₓ versus t, as acceleration is influenced by the net force applied over time.
Video consigliato:
Percorso guidato
05:59
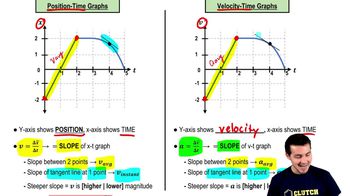
Velocity-Time Graphs & Acceleration

Acceleration

Acceleration is defined as the rate of change of velocity of an object with respect to time. It can be calculated by dividing the net force acting on the object by its mass, as per Newton's Second Law. In this context, the acceleration graph aₓ versus t will reflect how the object's acceleration varies as the force Fₓ changes over time, providing insights into the object's motion along the x-axis.
Video consigliato:
Percorso guidato
05:47
Intro to Acceleration