Ch 19: The First Law of Thermodynamics
Young & Freedman Calc - University Physics 14th Edition
Young & Freedman Calc14th EditionUniversity PhysicsISBN: 9780321973610Non è quello che usi tu?Cambia libro di testo
Capitolo 19, Problema 11a

The process abcabc shown in the pVpV-diagram in Fig. E19.1119.11 involves 0.01750.0175 mol of an ideal gas. What was the lowest temperature the gas reached in this process? Where did it occur?
pV-diagram illustrating process abc with points a, b, and c for an ideal gas.

Guida verificata passo dopo passo
1
Identify the points a, b, and c on the pV-diagram. Note the pressure and volume at each point: a (P = 0.20 atm, V = 2.0 L), b (P = 0.60 atm, V = 2.0 L), and c (P = 0.40 atm, V = 6.0 L).
Use the ideal gas law to find the temperature at each point. The ideal gas law is given by: PV=nRT, where P is pressure, V is volume, n is the number of moles, R is the ideal gas constant (0.0821 L·atm/mol·K), and T is temperature in Kelvin.
Calculate the temperature at point a using the values: P = 0.20 atm, V = 2.0 L, and n = 0.0175 mol. Rearrange the ideal gas law to solve for T: T=PVnR.
Calculate the temperature at point b using the values: P = 0.60 atm, V = 2.0 L, and n = 0.0175 mol. Use the same rearranged ideal gas law to solve for T.
Calculate the temperature at point c using the values: P = 0.40 atm, V = 6.0 L, and n = 0.0175 mol. Again, use the rearranged ideal gas law to solve for T. Compare the temperatures at points a, b, and c to determine the lowest temperature and identify where it occurs.

Risposta video verificata per un problema simile:

Questa soluzione video è stata consigliata dai nostri tutor come utile per risolvere questo problema.
Durata del video:
8m

Concetti chiave

Ecco i concetti essenziali che devi comprendere per rispondere correttamente alla domanda.

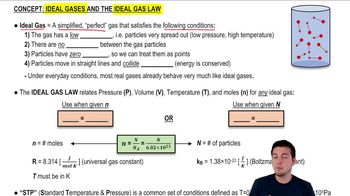
Ideal Gas Law

The Ideal Gas Law relates the pressure (P), volume (V), and temperature (T) of an ideal gas through the equation PV = nRT, where n is the number of moles and R is the ideal gas constant. This law is fundamental for understanding the behavior of gases under various conditions, allowing us to calculate one variable if the others are known.
Video consigliato:
Percorso guidato
07:21
Ideal Gases and the Ideal Gas Law

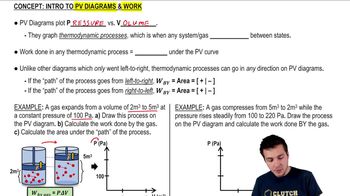
pV Diagram

A pV diagram is a graphical representation of the relationship between pressure and volume for a gas. In this diagram, different points represent states of the gas, and the paths between these points indicate processes such as isothermal or adiabatic changes. Analyzing the areas and slopes on this diagram helps in understanding work done and heat transfer during gas processes.
Video consigliato:
Percorso guidato
08:07
Work and PV Diagrams

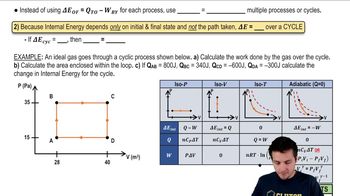
Thermodynamic Processes

Thermodynamic processes describe the changes in state variables of a system, such as pressure, volume, and temperature. In the context of the pV diagram, processes can be isothermal (constant temperature), isobaric (constant pressure), or adiabatic (no heat exchange). Identifying the type of process is crucial for determining the lowest temperature reached by the gas during the transition from point a to point c.
Video consigliato:
Percorso guidato
08:45
Properties of Cyclic Thermodynamic Processes
Pratica correlata
Domanda del libro di testo

Five moles of an ideal monatomic gas with an initial temperature of 127127°C expand and, in the process, absorb 15001500 J of heat and do 21002100 J of work. What is the final temperature of the gas?

2210
views
Domanda del libro di testo

A gas in a cylinder is held at a constant pressure of 1.80×1051.80\(\times\)10^5 Pa and is cooled and compressed from 1.701.70 m3 to 1.201.20 m3. The internal energy of the gas decreases by 1.40×1051.40\(\times\)10^5 J. Does it matter whether the gas is ideal? Why or why not?

1730
views
Domanda del libro di testo

A gas in a cylinder expands from a volume of 0.1100.110 m3 to 0.3200.320 m3 . Heat flows into the gas just rapidly enough to keep the pressure constant at 1.65×1051.65\(\times\)10^5 Pa during the expansion. The total heat added is 1.15×1051.15\(\times\)10^5 J. Find the work done by the gas.

1752
views
Domanda del libro di testo

The pVpV-diagram in Fig. E19.1319.13 shows a process abcabc involving 0.4500.450 mol of an ideal gas. How much heat had to be added during the process to increase the internal energy of the gas by 15,00015,000 J?

2232
views
Domanda del libro di testo

Figure E19.819.8 shows a pVpV-diagram for an ideal gas in which its absolute temperature at bb is one-fourth of its absolute temperature at aa. Did heat enter or leave the gas from aa to bb? How do you know?

2562
views
Domanda del libro di testo

When water is boiled at a pressure of 2.002.00 atm, the heat of vaporization is 2.20×1062.20\(\times\)10^6 J/kg and the boiling point is 120120°C. At this pressure, 1.001.00 kg of water has a volume of 1.00×10−31.00\(\times\)10^{-3} m3, and 1.001.00 kg of steam has a volume of 0.8240.824 m3. Compute the work done when 1.001.00 kg of steam is formed at this temperature.

4116
views