 Indietro
Functions and Their Graphs: Identifying and Analyzing Graphs of Functions
Guida di studio - Note intelligenti
 Appunti personalizzati basati sui tuoi materiali, ampliati con definizioni chiave, esempi e contesto.
Chapter 2: Functions and Their Graphs
Section 2.2: The Graph of a Function
This section explores how to identify the graph of a function and how to extract information from such graphs. Understanding these concepts is fundamental for analyzing mathematical relationships and interpreting real-world data using functions.
Identifying the Graph of a Function
The graph of a function is the set of points \((x, y)\) in the xy-plane that satisfy the function's equation. Not every collection of points represents a function. For a relation to be a function, each value of x in the domain must correspond to exactly one value of y in the range.
Definition: A function is a relation in which each input (x-value) has exactly one output (y-value).
Vertical-Line Test: A set of points in the xy-plane is the graph of a function if and only if every vertical line intersects the graph at most once.
Key Point: If a vertical line crosses the graph more than once, the relation is not a function.
Example: Identifying Graphs of Functions
Consider the following graphs:
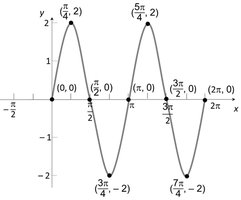
Graph (a): This graph passes the vertical-line test, so it represents a function.
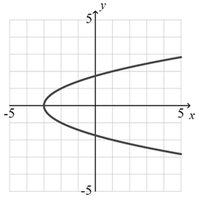
Graph (b): This graph fails the vertical-line test, so it does not represent a function.
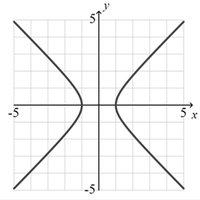
Graph (c): This graph fails the vertical-line test, so it does not represent a function.
Graph (d): This graph passes the vertical-line test, so it represents a function.
Example Images:
Graph (a): Function (passes vertical-line test)
Graph (b): Not a function (fails vertical-line test)
Graph (c): Not a function (fails vertical-line test)
Obtaining Information from or about the Graph of a Function
Once a graph is identified as a function, you can extract valuable information from it. The point \((x, y)\) on the graph means that y = f(x). Conversely, if f(x) = y, then \((x, y)\) is a point on the graph.
Domain: The set of all possible x-values for which the function is defined.
Range: The set of all possible y-values that the function can take.
Intercepts: Points where the graph crosses the axes. The x-intercept is where y = 0, and the y-intercept is where x = 0.
Example: If the point \((-1, 3)\) is on the graph of f, then f(-1) = 3.
Example: Analyzing a Function's Graph
Given a graph of a function f:
Find values: Determine f(a) for specific values of a by locating the corresponding point on the graph.
Domain and Range: Identify the domain and range by observing the extent of the graph along the x- and y-axes.
Intercepts: List all points where the graph crosses the axes.
Intersection with lines: Count how many times a given line (e.g., y = c) intersects the graph.
Solving equations: Find values of x for which f(x) = k or f(x) > k.
Example: Cost Function for a Trans-Atlantic Flight
Suppose the cost C per passenger for a flight is given by a function of ground speed x:
Formula:
Application: Calculate C(x) for specific values of x (e.g., 470 mph).
Domain: Identify the set of possible ground speeds for which the cost function is defined.
Graphing: Use a graphing calculator to visualize C(x) over a range of x values.
Table: Create a table of values for C(x) at intervals (e.g., 450, 500, 550, 600 mph).
Optimization: Find the ground speed that minimizes the cost per passenger.
x | C(x) |
|---|---|
450 | Value for C(450) |
500 | Value for C(500) |
550 | Value for C(550) |
600 | Value for C(600) |
Additional info: Table values are inferred as placeholders; actual values depend on the specific cost function formula.
Summary Table: Vertical-Line Test for Functions
Graph | Function? | Reason |
|---|---|---|
Graph (a) | Yes | Every vertical line intersects at most once |
Graph (b) | No | Some vertical lines intersect more than once |
Graph (c) | No | Some vertical lines intersect more than once |
Graph (d) | Yes | Every vertical line intersects at most once |
