 Indietro
Graphs, Functions, and the Rectangular Coordinate System: Precalculus Study Guide
Guida di studio - Note intelligenti
 Appunti personalizzati basati sui tuoi materiali, ampliati con definizioni chiave, esempi e contesto.
Rectangular Coordinate System
Basic Concepts and Plotting Points
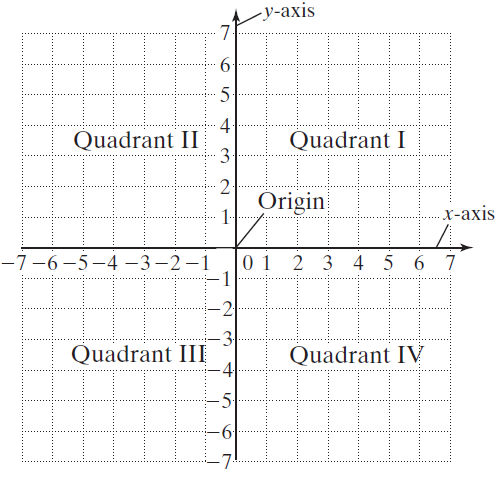
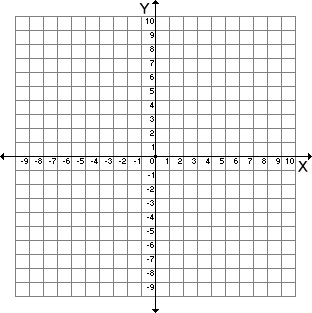
The rectangular coordinate system, also known as the Cartesian plane, is fundamental for graphing equations and visualizing mathematical relationships. It consists of two perpendicular axes: the x-axis (horizontal) and the y-axis (vertical), which intersect at the origin (0,0). The plane is divided into four quadrants, each with distinct sign conventions for coordinates.
Ordered Pair (x, y): Represents a point's location, where x is the horizontal coordinate and y is the vertical coordinate.
Quadrants: I (+,+), II (−,+), III (−,−), IV (+,−)
Origin: The intersection of the axes, (0,0)
Plotting Points and Graphing Equations
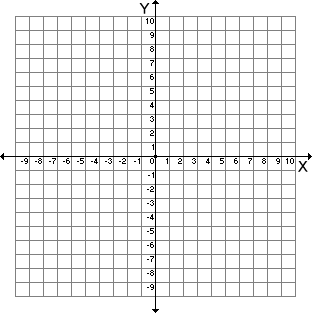
To plot points, locate the x-coordinate on the horizontal axis and the y-coordinate on the vertical axis. Graphing equations involves plotting multiple points that satisfy the equation and connecting them to reveal the relationship.
Example: Plot (4,5), (−4,−5), (−1,3), (3,−1), (−2,0), (0,−3)
Graphing Linear Equations
Point-Plotting Method
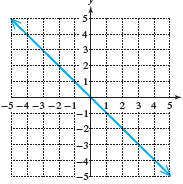
Graphing equations such as y = 4 − x or y = x − 3 can be done by selecting values for x, calculating corresponding y values, and plotting the resulting points.
Linear equations produce straight lines.
Absolute value and quadratic equations produce V-shaped and parabolic graphs, respectively.
Intercepts
Definitions and Identification
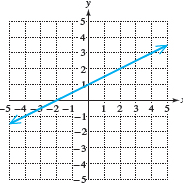
Intercepts are points where a graph crosses the axes:
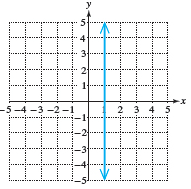
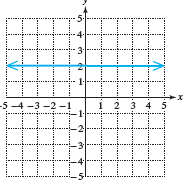
x-intercept: Where the graph crosses the x-axis (y = 0).
y-intercept: Where the graph crosses the y-axis (x = 0).
To find intercepts, set the opposite variable to zero and solve for the remaining variable.
Interpreting Graphs and Applications
Modeling Real-World Data
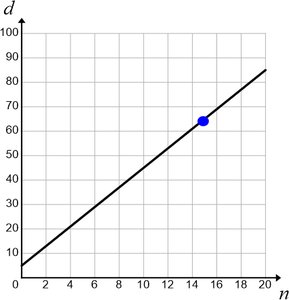
Graphs can represent real-world relationships, such as the percentage of marriages ending in divorce after n years. For example, the equation d = 4n + 5 models this relationship, and the graph can be used to estimate values and check calculations.
Example: For n = 15, d = 4(15) + 5 = 65%
Functions and Relations
Definitions and Properties
A relation is any set of ordered pairs. The domain is the set of all first components (x-values), and the range is the set of all second components (y-values). A function is a relation where each element in the domain corresponds to exactly one element in the range.
Function Notation: f(x) represents the value of the function at x.
If an equation yields more than one y for a given x, it is not a function.
Vertical Line Test
The vertical line test determines if a graph represents a function: if any vertical line intersects the graph more than once, it is not a function.
Evaluating and Graphing Functions
Examples and Applications
To evaluate a function, substitute the given value for x and compute f(x). Graphing functions involves plotting points for various x-values and connecting them.
Analyzing Graphs: Domain, Range, and Intercepts
Identifying Domain and Range from Graphs
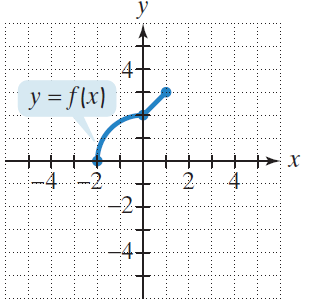
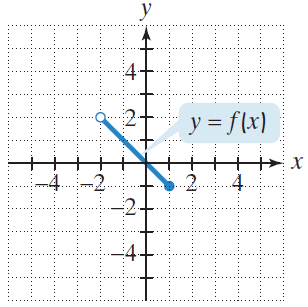
The domain of a function is all x-values for which the function is defined, and the range is all y-values the function attains. Intercepts are found by observing where the graph crosses the axes.
Function Values from Graphs
Reading Values and Solving for Inputs
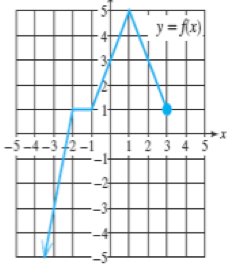
Given a graph, you can find function values for specific x-values and determine x-values for which the function attains certain y-values.
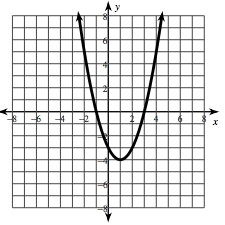
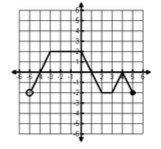
Increasing, Decreasing, and Constant Functions
Definitions and Identification
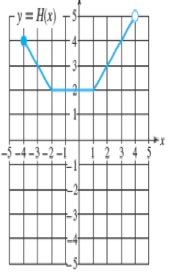
A function is increasing on an interval if its values rise as x increases, decreasing if its values fall, and constant if its values remain unchanged.
Use the graph to identify intervals of increase, decrease, or constancy.
Relative Maxima and Minima
Definitions
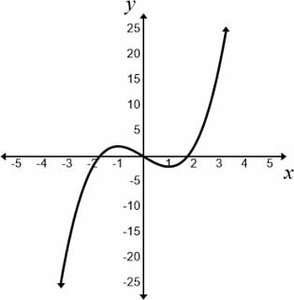
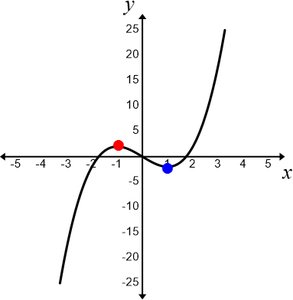
A relative maximum is a point where the function attains a highest value within a neighborhood, and a relative minimum is where it attains a lowest value.
Even and Odd Functions; Symmetry
Definitions and Graphical Symmetry
An even function satisfies f(−x) = f(x) and is symmetric about the y-axis. An odd function satisfies f(−x) = −f(x) and is symmetric about the origin. Symmetry with respect to the x-axis occurs if (x, y) and (x, −y) are both on the graph.
Piecewise Functions
Definition and Evaluation
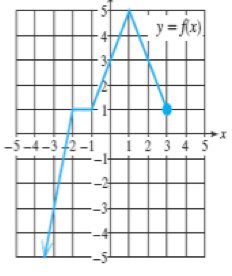
A piecewise function is defined by different expressions over different intervals of its domain. To evaluate, determine which piece applies for the given x-value.
Difference Quotient
Definition
The difference quotient is a fundamental concept for understanding rates of change and is defined as:
for
Linear Functions and Slope
Definitions and Forms of Linear Equations
The slope of a line measures its steepness and is calculated as:
Common forms of linear equations:
Point-slope form:
Slope-intercept form:
General form:
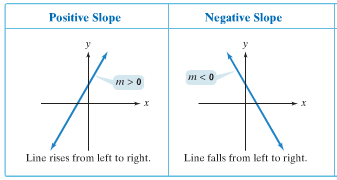
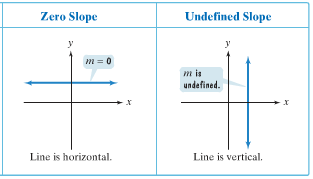
Graphing Lines Using Slope and Intercepts
Examples
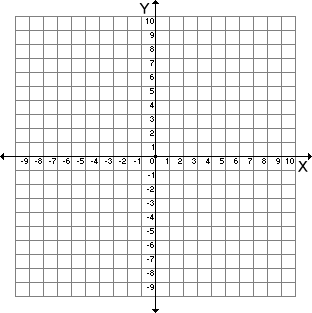
Lines can be graphed using their slope and y-intercept, or by finding their x- and y-intercepts.
Transformations of Functions
Vertical and Horizontal Shifts
Shifting a graph vertically or horizontally changes its position without altering its shape:
Vertical shift: (up), (down)
Horizontal shift: (left), (right)
Reflections
Reflecting a graph about the x-axis or y-axis changes its orientation:
x-axis reflection:
y-axis reflection:
Stretching and Shrinking
Multiplying a function by a constant stretches or shrinks its graph:
Vertical stretch: ,
Vertical shrink: ,
Horizontal shrink: ,
Horizontal stretch: ,
Combinations and Compositions of Functions
Algebra of Functions
Functions can be combined using addition, subtraction, multiplication, and division. The domain of the resulting function is the intersection of the domains of the original functions, excluding values that cause division by zero or even roots of negative numbers.
Sum:
Difference:
Product:
Quotient:
Composite Functions
The composition of functions f and g is . The domain is all x such that x is in the domain of g and g(x) is in the domain of f.
Inverse Functions
Definition and Verification
The inverse of a function f, denoted , satisfies and . The horizontal line test determines if a function has an inverse: if no horizontal line intersects the graph more than once, the function is one-to-one and has an inverse.
To find the inverse: replace f(x) with y, interchange x and y, solve for y, and replace y with .
Circles
Standard Form of the Equation of a Circle
The standard form of a circle's equation is:
where (h, k) is the center and r is the radius. The domain and range can be determined from the graph.
Summary Table: Common Function Types
Comparison of Properties
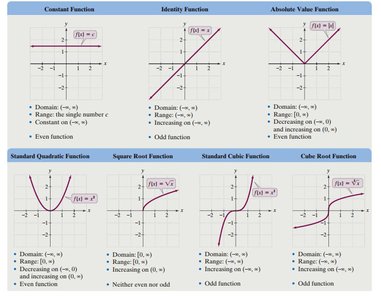
The following table summarizes the properties of several common functions:
Function | Domain | Range | Even/Odd | Increasing/Decreasing |
|---|---|---|---|---|
Constant | All real numbers | Single value | Even | Constant |
Identity | All real numbers | All real numbers | Odd | Increasing |
Absolute Value | All real numbers | Even | Decreasing on , Increasing on | |
Quadratic | All real numbers | Even | Decreasing then Increasing | |
Square Root | Neither | Increasing | ||
Cubic | All real numbers | All real numbers | Odd | Increasing |
Cube Root | All real numbers | All real numbers | Odd | Increasing |
Additional info: These notes cover the foundational concepts of Precalculus, including graphing, functions, transformations, and the properties of common function types. All images included are directly relevant to the explanations and reinforce the visual understanding of the concepts.
