 Indietro
Graphs of Equations in Two Variables: Intercepts and Symmetry
Guida di studio - Note intelligenti
 Appunti personalizzati basati sui tuoi materiali, ampliati con definizioni chiave, esempi e contesto.
Chapter 1: Graphs
Section 1.2: Graphs of Equations in Two Variables; Intercepts; Symmetry
This section introduces the fundamental concepts of graphing equations in two variables, identifying intercepts, and analyzing symmetry. These skills are essential for understanding the behavior of mathematical functions and their graphical representations in the xy-plane.
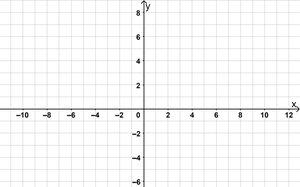
Graphing Equations by Plotting Points
An equation in two variables (such as x and y) is a statement where two expressions involving x and y are equal. The expressions are called the sides of the equation. Any values of x and y that make the equation true are said to satisfy the equation.
Graph of an Equation: The set of all points (x, y) in the xy-plane that satisfy the equation.
Plotting Points: Choose values for one variable, solve for the other, and plot the resulting ordered pairs.
Example: To graph y = 2x + 1, select values for x, compute corresponding y values, and plot the points.
Intercepts of a Graph
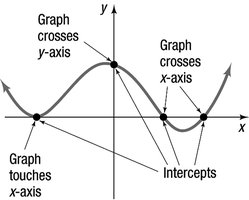
The intercepts of a graph are the points where it crosses or touches the coordinate axes. These are important for understanding the location and behavior of the graph.
x-intercept: The x-coordinate where the graph crosses or touches the x-axis (y = 0).
y-intercept: The y-coordinate where the graph crosses or touches the y-axis (x = 0).
Intercepts as Points: Intercepts are written as ordered pairs, but the x-intercept or y-intercept is a number.
Example: For the equation y = x2 - 2x - 3, set y = 0 to find x-intercepts, and set x = 0 to find y-intercepts.
Finding Intercepts from an Equation
To find intercepts algebraically:
Finding x-intercepts: Let y = 0 in the equation and solve for x.
Finding y-intercepts: Let x = 0 in the equation and solve for y.
Example: For y = x2 - 2x - 3:
Set y = 0:
Set x = 0:
Symmetry of Graphs
Symmetry helps identify patterns and properties of graphs. There are three main types:
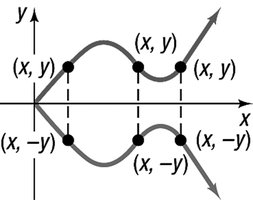
x-axis symmetry: If (x, y) is on the graph, then (x, -y) is also on the graph.
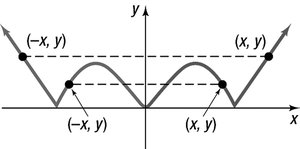
y-axis symmetry: If (x, y) is on the graph, then (-x, y) is also on the graph.
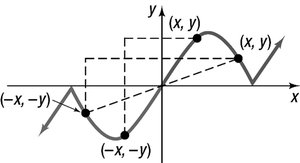
Origin symmetry: If (x, y) is on the graph, then (-x, -y) is also on the graph.
To test for symmetry:
x-axis: Replace y with -y in the equation and simplify.
y-axis: Replace x with -x in the equation and simplify.
Origin: Replace x with -x and y with -y in the equation and simplify.
Graphing Key Equations
Understanding the graphs of key equations is essential. Intercepts, symmetry, and plotting points are used to graph these equations.
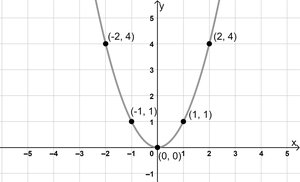
Example: The graph of is U-shaped and opens upward. Key points include (-2, 4), (-1, 1), (0, 0), (1, 1), and (2, 4).
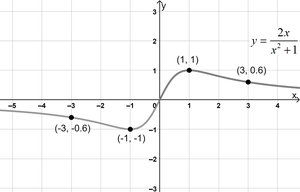
Example: The graph of shows intercepts and symmetry properties.
Summary Table: Types of Symmetry
Type of Symmetry | Test | Result |
|---|---|---|
x-axis | Replace y with -y | If equivalent, symmetric about x-axis |
y-axis | Replace x with -x | If equivalent, symmetric about y-axis |
Origin | Replace x with -x and y with -y | If equivalent, symmetric about origin |
Additional info:
Graphs should be shown with enough points to illustrate their general shape and behavior.
Intercepts and symmetry are foundational concepts for later topics in functions and analytic geometry.
