 Indietro
Geographic Data and Methods: Sociological Applications
Guida di studio - Note intelligenti
 Appunti personalizzati basati sui tuoi materiali, ampliati con definizioni chiave, esempi e contesto.
Geographic Data in Sociology
Introduction
Geographic data and geospatial technologies are increasingly important in sociological research, especially for understanding population distribution, social stratification, and the impact of environmental and social changes. Sociologists use these tools to analyze patterns, relationships, and trends within societies.
Ways Geographers Gather Data
Geospatial Technology
Geospatial technology refers to tools and techniques used to collect, analyze, and visualize spatial data. These technologies are essential for studying social phenomena that have a spatial component, such as urbanization, migration, and inequality.
Remote Sensing: The collection of data from satellites or aircraft to observe and analyze Earth's surface. Useful for studying land use changes, disaster impacts, and uninhabitable regions.
Applications: Land use change, agricultural studies, disaster impact assessment.
Example: Satellite images before and after Hurricane Katrina reveal flooding and land changes.

Geographic Information Systems (GIS)
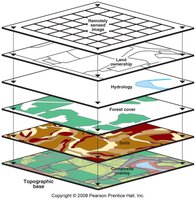
GIS combines hardware and software to create detailed maps with multiple data layers. It allows researchers to analyze spatial relationships and patterns more effectively than traditional methods.
Key Features: Layered mapping, spatial data analysis, integration of diverse datasets.
Uses: Tracking natural resources, site selection for businesses, military planning.
Example: GIS can help determine the best location for a new restaurant by analyzing population density, traffic patterns, and competitor locations.
Satellite Navigation Systems (GPS)
Satellite navigation systems, such as GPS, provide precise location data for navigation, automated vehicles, and surveillance. While valuable for spatial analysis, they may miss important human processes and social dynamics.
Primary Purpose: Navigation and location tracking.
Applications: Automated vehicles, urban planning, emergency response.
Limitations: Lack of insight into human behavior and social processes.

Quantitative Data Collection Methods
Census Data and Government Reports
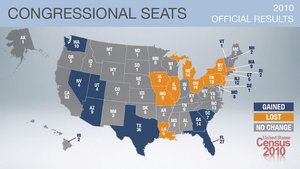
Census data is collected every ten years and is crucial for understanding population distribution, social stratification, and resource allocation. It is capital intensive and mandated by the Constitution to ensure fair representation and funding.
Purpose: Reallocate House of Representatives seats, distribute government funding.
Problems: Undercounting, double-counting, accuracy concerns.
Example: Congressional seat changes based on census results.
Surveys and Questionnaires
Surveys are widely used to collect quantitative data about social attitudes, behaviors, and demographics. However, they are susceptible to biases based on funding sources, sampling methods, and question phrasing.
Potential Biases: Who paid for the survey, random and representative sampling, sample size, question phrasing.
Accuracy: Typically +/- 3% if sampling is random and representative.
Example: Surveys can be manipulated to influence public opinion or policy.

Qualitative Data Collection Methods
Fieldwork and Interviews
Qualitative methods such as fieldwork, interviews, and photographic interpretation provide deeper insights into human processes, culture, politics, and economics. These methods are essential for understanding the lived experiences and social dynamics within communities.
Applications: Studying language, religion, food, dress, government, conflict, social classes.
Limitations: Observer bias, ethnocentrism, lack of representation.
Aggregation of Data
Definition and Importance
Aggregation refers to the process of summarizing individual data points into larger groups for analysis. The scale of aggregation can significantly affect the interpretation of data and the conclusions drawn from it.
Least Aggregated: Individual test scores (e.g., Dmitri, Mable, Alejandro).
More Aggregated: Scores by student, teacher, period, school, county, state, country, or globally.
Example: Aggregating test scores by school or county reveals broader patterns and trends.
Scale of Analysis
The scale of analysis determines the level at which data is aggregated and analyzed. Different scales can reveal different patterns and insights, which is crucial for sociological research.
Example: Thematic maps showing African-American population distribution in Georgia at state, metropolitan, and census tract levels.
Application: Understanding social stratification and urbanization.
Cartograms and Thematic Maps
Visualizing Data
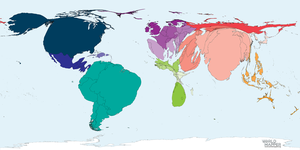
Cartograms and thematic maps are used to visually represent data, such as population distribution or COVID cases. These tools help sociologists and geographers identify spatial patterns and social inequalities.
Example: Cartogram of COVID cases shows the disproportionate impact across regions.
Conclusion
Geographic data and geospatial technologies are vital for sociological research, enabling the study of social patterns, stratification, and change. Understanding the methods of data collection, aggregation, and visualization is essential for interpreting social phenomena and informing policy decisions.
