2. Describing Data with Tables and Graphs - Parte 1 di 2!
2. Describing Data with Tables and Graphs / Histograms / Problema 6
Problema 6
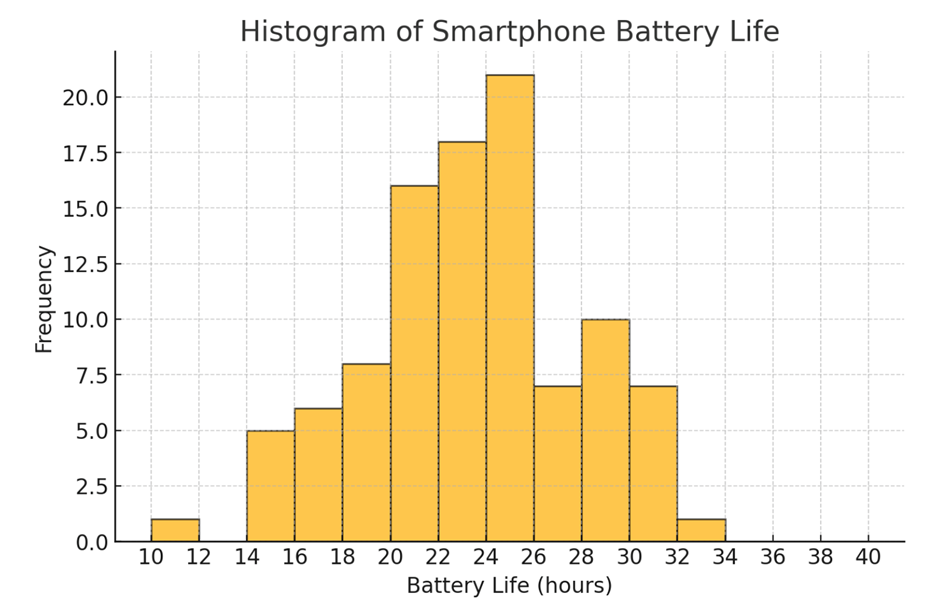
Use the following histogram generated by statistical software, which represents the battery life (in hours) of a sample of smartphones. Provide the estimated class width, along with the lower- and upper-class limits of the fourth bar from the left in the histogram.