2. Describing Data with Tables and Graphs / Dot Plots / Problema 3
Problema 3
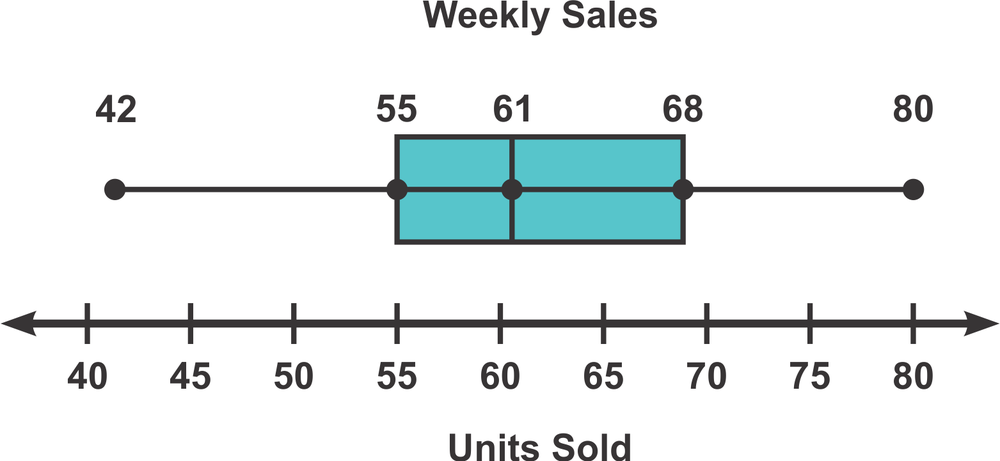
The box and whisker plot shown represents the weekly sales in units of its sales representatives. What percentage of the sales representatives sold more than units in a week?