 Indietro
Areas Under the Standard Normal Curve and Their Applications
Guida di studio - Note intelligenti
 Appunti personalizzati basati sui tuoi materiali, ampliati con definizioni chiave, esempi e contesto.
Areas Under the Standard Normal Curve
Introduction to Areas Under Curves
The area under a probability distribution curve, such as the standard normal curve, represents the total probability for all possible outcomes. For any probability density function (pdf), the total area under the curve and above the horizontal axis is exactly 1, corresponding to a probability of 1 (or 100%). This foundational concept allows us to interpret portions of the area as probabilities for specific events.
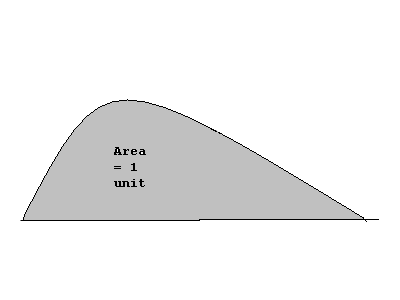
Probability Density Function (pdf): A function that describes the likelihood of a random variable to take on a particular value. The area under the entire curve equals 1.
Standard Normal Curve: A special case of the normal distribution with mean 0 and standard deviation 1.
Significance of Area = 1: The total area represents all possible outcomes, so any partial area corresponds to the probability of a subset of outcomes.
Using the Standard Normal Table (z-Table)
Structure and Interpretation of the z-Table
The standard normal table (z-table) provides the area to the left of a given z-score under the standard normal curve. The table is divided into two halves: one for negative z-scores and one for positive z-scores. Each entry gives the cumulative probability from the far left up to the specified z-value.
z-Score: The number of standard deviations a value is from the mean. Calculated as .
Area to the Left: For any z, the table gives , the probability that a standard normal variable is less than z.
Symmetry: The standard normal curve is symmetric about zero, so .
Types of Areas and How to Find Them
1. Area to the Left of a Given z-Score
To find the probability that a standard normal variable is less than a specific z-score, simply look up the value in the z-table. For example, the area to the left of z = -2 is 0.0228.
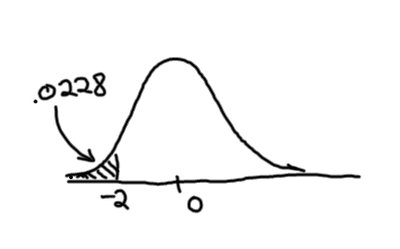
Example:
2. Area to the Left of a Positive z-Score
For positive z-scores, use the positive half of the table. For example, the area to the left of z = 1.23 is 0.8907.
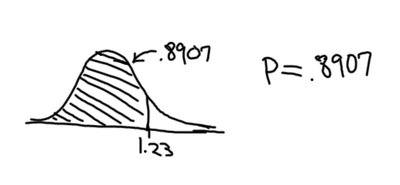
Example:
Area to the Left of Zero: (half the distribution is below the mean)
Area to the Left of 3: (almost all the distribution is below 3 standard deviations above the mean)
3. Area to the Right of a Given z-Score
To find the area to the right of a z-score, subtract the area to the left from 1:
Example: For z = 1.23,
Complement Rule: This method uses the probability rule
Symmetry Shortcut: due to the curve's symmetry
4. Area Between Two z-Scores
To find the area between two z-scores, subtract the area to the left of the smaller z from the area to the left of the larger z:
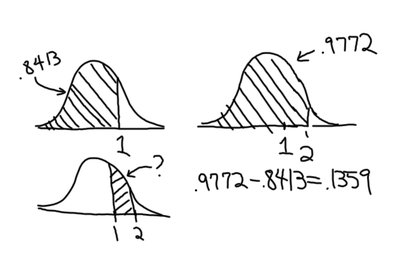
Example: Area between z = 1 and z = 2:
Note: Areas and probabilities cannot be negative; always subtract the smaller area from the larger.
Using Calculators for Normal Probabilities
Calculator Methods vs. Table Methods
Modern calculators can compute areas under the normal curve more accurately than tables, using the cumulative distribution function (normalcdf). The calculator typically requires two bounds (lower and upper) to compute the area between them.
Calculator Input: normalcdf(lower bound, upper bound)
For area to the left: Use a very large negative number as the lower bound (e.g., -999, 2)
For area to the right: Use the z-score as the lower bound and a very large positive number as the upper bound (e.g., 1.23, 999)
Accuracy: Calculators provide more decimal places and thus more accurate results than tables, which are rounded.
Recommendation: For homework and quizzes, use the table to match expected answers; for other purposes, the calculator is preferred for speed and accuracy.
Summary Table: Finding Areas Under the Standard Normal Curve
Type of Area | How to Find | Formula | Example |
|---|---|---|---|
Left of z | Look up z in table | ||
Right of z | 1 minus area to left | ||
Between a and b | Subtract left areas |
Key Takeaways
The area under the standard normal curve represents probability.
The z-table gives cumulative probabilities to the left of a z-score.
Areas to the right or between values require simple calculations using the table values.
Calculators can be used for more accurate and efficient computation of these areas.
