 Indietro
Introduction to Statistics: Foundations, Data Types, Study Designs, and Sampling Methods
Guida di studio - Note intelligenti
 Appunti personalizzati basati sui tuoi materiali, ampliati con definizioni chiave, esempi e contesto.
Statistics: The Art and Science of Learning From Data
The Statistical Process of Discovery
Statistics is a systematic discipline that enables us to learn from data. The statistical process involves several key steps that guide researchers from formulating questions to interpreting results.
Formulate a research question: Clearly define what you want to investigate.
Collect relevant data: Gather information that will help answer the research question.
Analyze the data: Use statistical methods to summarize and explore the data.
Draw conclusions and generalize findings: Interpret the results and make inferences about the broader population.

Descriptive vs. Inferential Statistics
Types of Statistical Analysis
Statistics is divided into two main branches, each with distinct goals and methods:
Descriptive Statistics: Summarizes and organizes data using measures such as averages, percentages, counts, tables, and graphs.
Inferential Statistics: Makes inferences about a population based on data collected from a sample. This branch uses probability theory to estimate population parameters and test hypotheses.
Key Definitions in Statistics
Data, Variables, and Observations
Understanding the basic terminology is essential for working with data:
Data: Recorded characteristics or measurements that provide meaningful information.
Variable: A characteristic or property that can take on different values (e.g., age, height, test score).
Individual/Subject/Unit: The person or entity being measured.
Observation (Case/Record): The entire set of values of variables measured on an individual (often represented as a row in a data table).

Types of Variables
Qualitative (Categorical) vs. Quantitative (Numerical) Variables
Variables are classified based on the type of data they represent, which determines the appropriate methods for analysis and visualization.
Quantitative (Numerical) Variables: Measured using numbers. Subtypes include:
Discrete: Countable values, usually integers (e.g., number of children).
Continuous: Can take any value within a range, limited only by measurement precision (e.g., height, temperature).
Qualitative (Categorical) Variables: Descriptive and grouped into categories. Subtypes include:
Nominal: Purely descriptive categories (e.g., blood type, eye color).
Ordinal: Categories with a natural order (e.g., pain level: mild, moderate, severe).
Dichotomous (Binary): Only two possible outcomes (e.g., Yes/No, Pass/Fail).
Populations, Samples, Parameters, and Statistics
From Populations to Samples
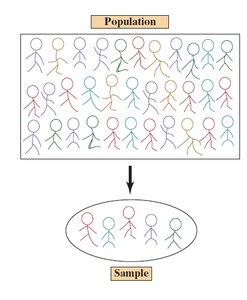
In statistics, we often want to draw conclusions about a large group (population) but can only collect data from a smaller group (sample). Understanding the distinction between populations and samples is fundamental to statistical inference.
Population: The entire group of interest (e.g., all students at a university).
Sample: A subset of the population that is actually measured (e.g., 200 students surveyed).
Parameter: A numerical summary calculated from the entire population (often denoted with Greek letters, e.g., for mean, for standard deviation, for proportion).
Statistic: A numerical summary calculated from the sample (e.g., for sample mean, for sample standard deviation, for sample proportion).
Concept | Population | Sample |
|---|---|---|
Mean | ||
Standard Deviation | ||
Proportion | ||
Size |
Proportion
A proportion is a type of ratio that compares a part to the whole. For example, if 18 out of 30 students own a Dell laptop, the proportion is .
Study Designs
Observational Studies vs. Experiments
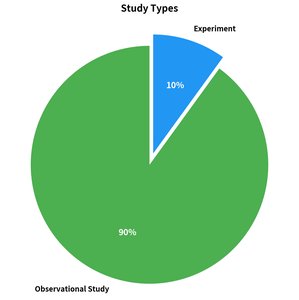
There are two primary types of study designs in statistics:
Observational Studies: Researchers observe phenomena without intervention. These studies can identify associations but cannot establish causation due to potential confounding variables.
Experiments: Researchers actively manipulate one or more variables (independent variables or factors) to observe their effect on another variable (dependent variable or response). Well-designed experiments can establish causality.
Types of Observational Studies
Cross-Sectional Study: Measurements are made at a single point in time.
Longitudinal Study: Multiple measurements are made on subjects over a long period.
Time-Series Study: Measurements are made on a single subject over time.
Limitation: Observational studies cannot prove causation; they can only indicate correlation.
Key Principles of Experimental Studies
Manipulation: Applying a treatment or intervention.
Control Group: A group that does not receive the treatment, used for comparison.
Randomization: Randomly assigning subjects to treatment groups to reduce bias.
Replication: Using enough subjects to ensure reliable results.
Causality: Experiments can provide strong evidence for cause-and-effect relationships.
Basic Terminology in Experiments
Experimental Units (Subjects): The entities to which treatments are applied.
Treatment: The condition applied to subjects (e.g., a new drug, a placebo).
Response Variable: The outcome measured to compare treatments (e.g., crop yield, cholesterol level).
Blinding in Experiments
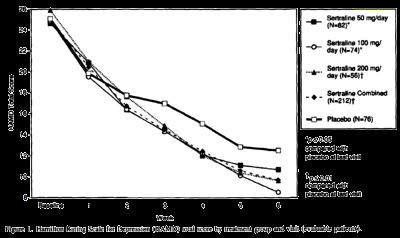
Single-Blind: Subjects do not know their treatment assignment.
Double-Blind: Neither subjects nor researchers know the treatment assignment; only an independent third party knows.
Placebo: An inert treatment used to control for psychological effects.
Treatment Effect: The degree to which the active treatment outperforms the placebo.
Random Sampling vs. Random Assignment
Random Sampling: Ensures the sample is representative of the population, allowing generalization of results.
Random Assignment: Ensures treatment groups are comparable, allowing cause-and-effect conclusions.
Key Difference: Random sampling determines who is in the study; random assignment determines who gets which treatment.
Types of Experimental Designs
Completely Randomized Design (CRD): Subjects are randomly assigned to treatment groups.
Matched Pairs Design: Multiple treatments are given to the same or similar subjects (e.g., before-and-after studies, studies on identical twins).
Sampling Designs
The Sampling Frame and Sampling Design
The sampling frame is the list of subjects in the population from which the sample is taken. The sampling design is the method used to select subjects from the sampling frame.
Probability Sampling Methods
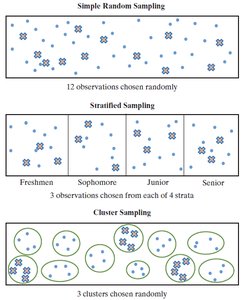
Simple Random Sampling (SRS): Every individual in the population has an equal chance of being selected.
Systematic Sampling: Select every kth individual from a list, starting at a random point.
Stratified Sampling: Divide the population into subgroups (strata) and take a random sample from each stratum.
Cluster Sampling: Divide the population into clusters, randomly select clusters, and include all individuals from selected clusters.
Sampling Method | Description | Example |
|---|---|---|
Simple Random Sampling | Every individual has an equal chance of selection | Randomly select 50 employees from a list |
Systematic Sampling | Select every k-th individual after a random start | Survey every 20th customer entering a store |
Stratified Sampling | Random sample from each subgroup (stratum) | Randomly select students from each year group |
Cluster Sampling | Randomly select entire groups (clusters) | Survey all students in 5 randomly chosen schools |
Stratified Sampling: Selects some individuals from all groups. Cluster Sampling: Selects all individuals from some groups.
Non-Probability Sampling Methods
Convenience Sampling: Sampling individuals who are easy to reach (e.g., friends, volunteers).
Voluntary-Response Sampling: Individuals choose to participate, often leading to bias.
Non-probability sampling methods can result in biased samples that do not accurately represent the population.
Bias in Sampling and Data Collection
Types of Bias
Bias: Systematic error that causes a sample or study to consistently misrepresent the population.
Response Bias: Participants give inaccurate or false answers (e.g., due to recall bias or leading questions).
Nonresponse Bias: Certain individuals do not respond, and their absence is related to the outcome being measured.
Undercoverage Bias: Some members of the population are inadequately represented or left out of the sample.
Understanding and minimizing bias is crucial for ensuring the validity and reliability of statistical conclusions.
