 Indietro
Introductory Statistics Practice Exam 1 – Guided Study Notes
Guida di studio - Note intelligenti
 Appunti personalizzati basati sui tuoi materiali, ampliati con definizioni chiave, esempi e contesto.
Q1. Population vs. Sample Identification
Background
Topic: Populations and Samples
This question tests your understanding of the difference between a population (the entire group of interest) and a sample (a subset of the population).
Key Terms:
Population: The complete set of individuals or items being studied.
Sample: A subset of the population, selected for analysis.
Step-by-Step Guidance
Read each statement carefully and identify whether it refers to the entire group (population) or just a part of it (sample).
Look for keywords like "all," "every," or "census" (which usually indicate a population), or numbers that are less than the total group (which often indicate a sample).
Decide for each statement if it describes a population or a sample, but do not write the final answer yet.
Try solving on your own before revealing the answer!
Final Answers:
A. Sample (530 out of 750 students is a subset, not the whole group)
B. Population (The average SAT math score for the entire freshman class)
C. Population (A census includes all households in St. Mary’s County)
Q2. Levels of Measurement
Background
Topic: Levels of Measurement
This question tests your ability to classify variables as nominal, ordinal, interval, or ratio based on their characteristics.
Key Terms:
Nominal: Categories with no order (e.g., names, labels).
Ordinal: Categories with a meaningful order, but differences are not measurable.
Interval: Ordered, measurable differences, but no true zero (e.g., temperature in Celsius).
Ratio: Ordered, measurable differences, and a true zero (e.g., height, weight, heart rate).
Step-by-Step Guidance
For each variable, ask: Is there a natural order? Can you measure differences? Is there a true zero?
Match the description to the correct level of measurement based on these criteria.
Write the appropriate level (nominal, ordinal, interval, or ratio) for each part, but do not reveal the final answers yet.
Try solving on your own before revealing the answer!
Final Answers:
A. Nominal (Phone numbers are labels, not quantities)
B. Ratio (Heart rates have a true zero and measurable differences)
C. Ordinal (Standings have a meaningful order, but differences are not measurable)
Q3. Observational Study vs. Experiment
Background
Topic: Types of Studies
This question tests your ability to distinguish between observational studies (where researchers observe without intervention) and experiments (where researchers apply a treatment or intervention).
Key Terms:
Observational Study: Researchers observe outcomes without manipulating variables.
Experiment: Researchers apply a treatment and observe the effects.
Step-by-Step Guidance
For each scenario, determine if the researchers are intervening or just observing.
If a treatment or intervention is applied, it is an experiment; if not, it is observational.
Assign the correct type to each scenario, but do not reveal the final answers yet.
Try solving on your own before revealing the answer!
Final Answers:
A. Experiment (Scientists are testing a new vaccine, which is an intervention)
B. Observational Study (Researchers are surveying opinions, not intervening)
C. Observational Study (You are observing dog breeds, not intervening)
Q4. Best Measure of Center
Background
Topic: Measures of Center
This question tests your understanding of when to use mean, median, or mode to describe the center of a data set.
Key Terms:
Mean: The arithmetic average; best for symmetric, quantitative data without outliers.
Median: The middle value; best for skewed data or data with outliers.
Mode: The most frequent value; best for categorical data.
Step-by-Step Guidance
Identify the type of data (categorical or quantitative) for each scenario.
Consider if the data might be skewed or have outliers.
Choose the most appropriate measure of center, but do not reveal the final answers yet.
Try solving on your own before revealing the answer!
Final Answers:
A. Mode (Color is categorical; mode is best)
B. Median (House values often have outliers; median is best)
C. Median (Salaries can be skewed by high earners; median is best)
Q5. Frequency Distribution and Related Calculations
Background
Topic: Frequency Distributions
This question tests your ability to organize raw data into classes, calculate class width, and determine frequencies, relative frequencies, and cumulative frequencies.
Key Terms and Formulas:
Class Width: (always round up)
Frequency: The count of data values in each class.
Relative Frequency:
Cumulative Frequency: The sum of frequencies for that class and all previous classes.
Step-by-Step Guidance
Find the minimum and maximum values in the data set.
Calculate the class width using the formula above and round up to the next whole number.
Set up the class limits for each class, starting from the minimum value and adding the class width each time.
Count how many data values fall into each class to find the frequencies.
For relative frequency, divide the frequency of the second class by the total number of data values.
For cumulative frequency, add up the frequencies for the first four classes.
Stop here and set up the calculations for the student to complete the final steps.
Try solving on your own before revealing the answer!
Final Answers:
A. Class Width: 4 (Max 99, Min 72, 7 classes: (99-72)/7 = 3.857, round up to 4)
B. Class Limits and Frequencies: (using class width 6)
Class 1: 72–77, Frequency: 7
Class 2: 78–83, Frequency: 10
Class 3: 84–89, Frequency: 4
Class 4: 90–95, Frequency: 4
Class 5: 96–101, Frequency: 5
C. Relative Frequency (Class 2): 10/30 = 0.333
D. Cumulative Frequency (Class 4): 7 + 10 + 4 + 4 = 25
Q6. Descriptive Statistics: Mean, Standard Deviation, Variance, Median
Background
Topic: Descriptive Statistics
This question tests your ability to calculate the mean, standard deviation, variance, and median for a small data set.
Key Formulas:
Mean:
Variance (Sample):
Standard Deviation (Sample):
Median: The middle value when data are ordered.
Step-by-Step Guidance
List the data in order: 11, 13, 15, 17, 18, 19, 21, 23.
Calculate the mean by summing all values and dividing by the number of values.
Find the variance by subtracting the mean from each value, squaring the result, summing these squares, and dividing by n-1.
Take the square root of the variance to find the standard deviation.
Find the median by locating the middle value(s) in the ordered list.
Set up the calculations for the student to complete the final steps.
Try solving on your own before revealing the answer!
Final Answers:
A. Mean:
B. Standard Deviation:
C. Variance:
D. Median: 17.5
Q7. Probability with Marbles
Background
Topic: Basic Probability
This question tests your ability to calculate probabilities for simple events using counts and fractions.
Key Formulas:
Probability:
Step-by-Step Guidance
Find the total number of marbles by adding all the red, white, and blue marbles.
For part A, use the number of white marbles as the numerator and the total as the denominator.
For part B, subtract the number of white marbles from the total to find the number of non-white marbles, then divide by the total.
Set up the fractions for each probability, but do not calculate the decimal answers yet.
Try solving on your own before revealing the answer!
Final Answers:
A.
B.
Q8. Probability and Frequency from a Pie Chart
Background
Topic: Probability and Frequency from Categorical Data
This question tests your ability to interpret a pie chart and calculate probabilities and expected counts from survey data.
Key Formulas:
Probability:
Expected Count:
Step-by-Step Guidance
Identify the proportion or percentage for "about once a week" from the pie chart.
For part A, divide the number in that category by the total surveyed to find the probability.
For part B, multiply the probability by the total number surveyed to find the expected count.
Set up the calculations for the student to complete the final steps.
Try solving on your own before revealing the answer!
Final Answers:
A. Probability: 0.12
B. Number of teens: 180
Q9. Mutually Exclusive Events
Background
Topic: Probability – Mutually Exclusive Events
This question tests your understanding of mutually exclusive events (events that cannot happen at the same time).
Key Terms:
Mutually Exclusive: Events that cannot both occur at the same time.
Not Mutually Exclusive: Events that can occur together.
Step-by-Step Guidance
Consider if it is possible for a blood donor to be both type O and female.
If yes, the events are not mutually exclusive; if no, they are mutually exclusive.
Explain your reasoning based on the definitions above.
Try solving on your own before revealing the answer!
Final Answer:
Not mutually exclusive. A blood donor can be both type O and female, so the events can occur together.
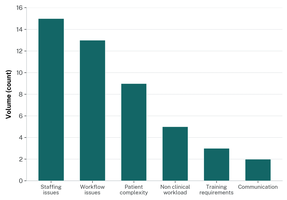
Q10. Probability from a Pareto Chart
Background
Topic: Probability from Frequency Data
This question tests your ability to use a Pareto chart to find probabilities for categorical events.
Key Formulas:
Probability:
Step-by-Step Guidance
Read the frequencies for each category from the Pareto chart.
For part A, use the frequency for "workflow issues" as the numerator and the total as the denominator.
For part B, add the frequencies for "non-clinical workload" and "staffing issues" for the numerator, and use the total as the denominator.
Set up the fractions for each probability, but do not calculate the decimal answers yet.
Try solving on your own before revealing the answer!
Final Answers:
A.
B.
Q11. Z-Scores and Unusual Values
Background
Topic: Z-Scores and Normal Distributions
This question tests your ability to calculate z-scores and interpret whether a value is unusual in a bell-shaped distribution.
Key Formula:
Z-Score:
Step-by-Step Guidance
For each tire, subtract the mean (34,000 miles) from the observed value.
Divide the result by the standard deviation (2,050 miles) to find the z-score.
Interpret the z-score: values with are often considered unusual.
Set up the calculations for each tire, but do not calculate the final z-scores or make the final interpretation yet.
Try solving on your own before revealing the answer!
Final Answers:
A. Tire A:
B. Tire B:
C. Tire C:
D. None of these z-scores are greater than 2 or less than -2, so none of these life spans are considered unusual.
