 Indietro
Measures of Central Tendency and Dispersion in Statistics
Guida di studio - Note intelligenti
 Appunti personalizzati basati sui tuoi materiali, ampliati con definizioni chiave, esempi e contesto.
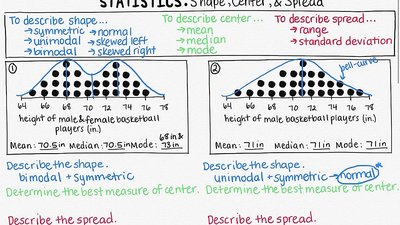
Measures of Central Tendency
Definition and Overview
Measures of central tendency are statistical values that describe the center or typical value of a dataset. The three most common measures are the mean, median, and mode. These measures help summarize a large set of data with a single representative value.
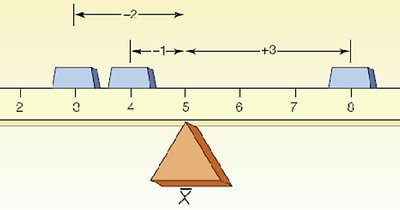
Mean: The arithmetic average, calculated by summing all values and dividing by the number of observations.
Median: The middle value when data are arranged in ascending order.
Mode: The value that appears most frequently in the dataset.
Mean
The mean is the most commonly used measure of central tendency, especially for quantitative data that are symmetrically distributed.
Population Mean (\(\mu\)):
Sample Mean (\(\bar{x}\)):
Where are the observed values, is the population size, and is the sample size.
Mean is sensitive to extreme values (not resistant).
Median
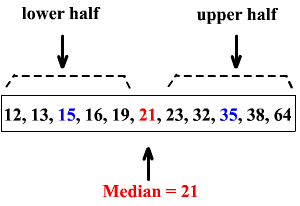
The median is the value that divides the dataset into two equal halves. It is especially useful for skewed distributions.
If is odd, the median is the middle value.
If is even, the median is the average of the two middle values.
Median is resistant to extreme values.
Mode
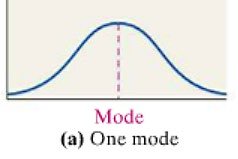
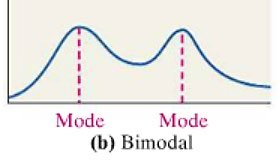
The mode is the value that occurs most frequently in a dataset. A dataset may have no mode, one mode (unimodal), or more than one mode (bimodal or multimodal).
Mode can be used for both quantitative and qualitative data.
Comparing Mean and Median
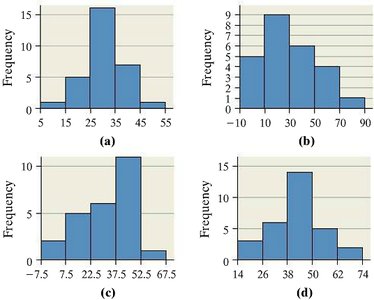
The relationship between the mean and median provides insight into the shape of the distribution:
Symmetric Distribution: Mean = Median
Skewed Left: Mean < Median
Skewed Right: Mean > Median
Measures of Dispersion
Definition and Overview
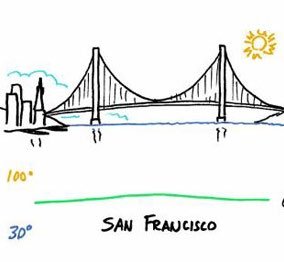
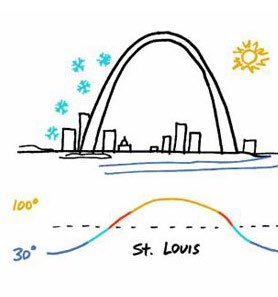
Measures of dispersion describe the spread or variability of a dataset. Common measures include the range, variance, and standard deviation.
Range: Difference between the largest and smallest values.
Variance: Average of the squared deviations from the mean.
Standard Deviation: Square root of the variance; measures average distance from the mean.
Range
The range is the simplest measure of dispersion, calculated as:
Range is not resistant to outliers.
Standard Deviation and Variance
The standard deviation is the most widely used measure of dispersion. It quantifies how much the values in a dataset deviate from the mean.
Population Standard Deviation (\(\sigma\)):
Sample Standard Deviation (\(s\)):
Variance: The square of the standard deviation ( for population, for sample).
Standard deviation is not resistant to outliers.

Comparing Dispersions
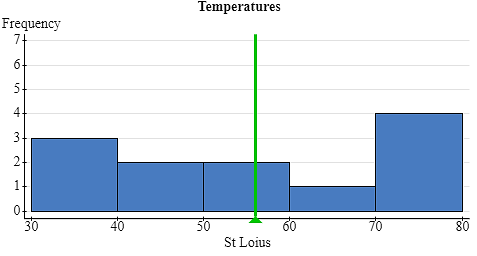
When comparing two datasets, the one with the larger standard deviation has greater dispersion.
Empirical Rule
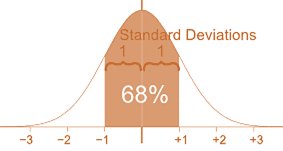
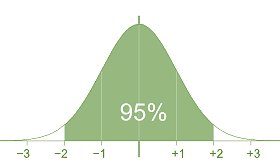
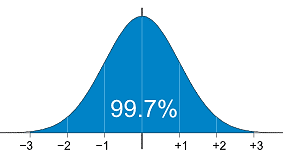
For bell-shaped (normal) distributions, the empirical rule states:
Approximately 68% of data within 1 standard deviation of the mean
Approximately 95% within 2 standard deviations
Approximately 99.7% within 3 standard deviations
Chebyshev's Inequality
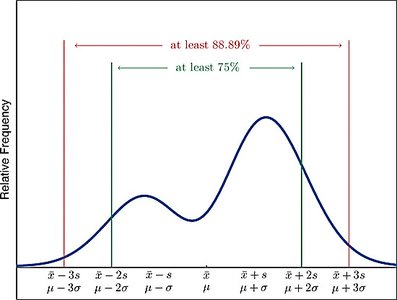
Chebyshev's Inequality applies to any data set, regardless of shape. It states that at least of the data values must lie within standard deviations of the mean, for .
Measures of Position
Z-Score
The z-score indicates how many standard deviations an observation is from the mean. It is calculated as:
Population:
Sample:
Z-scores are unitless and useful for comparing values from different distributions.
Percentiles and Quartiles
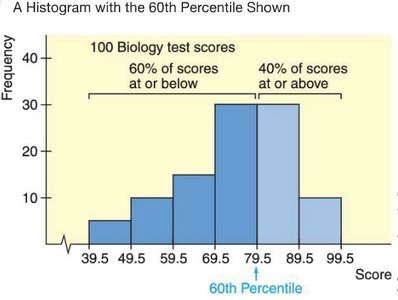
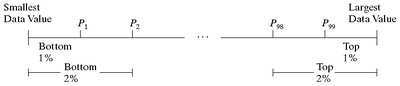
Percentiles divide the data into 100 equal parts. The th percentile, , is the value below which percent of the data fall. Quartiles are special percentiles that divide the data into four equal parts:
Q1: 25th percentile
Q2: 50th percentile (median)
Q3: 75th percentile

Five-Number Summary and Boxplots
Five-Number Summary
The five-number summary consists of the minimum, Q1, median, Q3, and maximum. It provides a concise summary of the distribution's center and spread.
Minimum: Smallest data value
Q1: First quartile
Median: Second quartile
Q3: Third quartile
Maximum: Largest data value
Boxplots
A boxplot is a graphical representation of the five-number summary. It displays the distribution's center, spread, and potential outliers.
The box spans from Q1 to Q3, with a line at the median.
Whiskers extend to the smallest and largest values within 1.5 times the interquartile range (IQR) from the quartiles.
Values outside the whiskers are considered outliers.
Summary Table: Measures of Central Tendency
Measure | Computation | Interpretation | Resistance | When to Use |
|---|---|---|---|---|
Mean | Sum values, divide by count | Center of gravity; uses all data | Not resistant | Quantitative, symmetric |
Median | Middle value | Divides bottom 50% from top 50% | Resistant | Quantitative, skewed |
Mode | Most frequent value | Most common observation | Resistant | Quantitative or qualitative |
