


Ch. 1 - Introduction to Statistics
Larson - Elementary Statistics: Picturing the World 8th Edition
Larson8th EditionElementary Statistics: Picturing the WorldISBN: 9780137493470Non è quello che usi tu?Cambia libro di testo
Capitolo 1, Problema 1.1.21

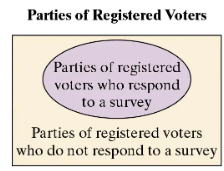
Use the Venn diagram to identify the population and the sample.


Guida verificata passo dopo passo
1
Step 1: Understand the definitions of population and sample. The population refers to the entire group of individuals or items being studied, while the sample is a subset of the population that is selected for analysis.
Step 2: Analyze the Venn diagram. The diagram shows two groups: 'Parties of registered voters who respond to a survey' (inside the oval) and 'Parties of registered voters who do not respond to a survey' (outside the oval).
Step 3: Identify the population. The population in this context is all registered voters, as the study is concerned with the parties of all registered voters, regardless of whether they respond to the survey or not.
Step 4: Identify the sample. The sample is the subset of registered voters who respond to the survey, as they are the ones whose data is being collected and analyzed.
Step 5: Conclude that the population encompasses both groups shown in the diagram, while the sample is specifically the group within the oval (respondents).

Risposta video verificata per un problema simile:

Questa soluzione video è stata consigliata dai nostri tutor come utile per risolvere questo problema.
Durata del video:
2m

Concetti chiave

Ecco i concetti essenziali che devi comprendere per rispondere correttamente alla domanda.

Population

In statistics, the population refers to the entire group of individuals or instances about which we seek to draw conclusions. In the context of the Venn diagram, the population consists of all registered voters, encompassing both those who respond to the survey and those who do not.
Video consigliato:
Percorso guidato
04:48
Population Standard Deviation Known

Sample

A sample is a subset of the population that is selected for analysis. In the Venn diagram, the sample is represented by the group of registered voters who respond to the survey. This smaller group is used to make inferences about the larger population.
Video consigliato:
Percorso guidato
05:11
Sampling Distribution of Sample Proportion

Venn Diagram

A Venn diagram is a visual tool used to illustrate the relationships between different sets. In this case, it helps to distinguish between the total population of registered voters and the sample of those who participated in the survey, highlighting the overlap and differences between the two groups.
Video consigliato:
Percorso guidato
5:14
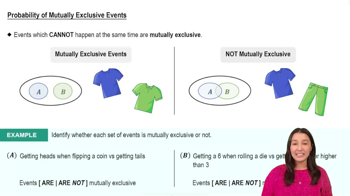
Probability of Mutually Exclusive Events