Ch. 2 - Descriptive Statistics
Larson - Elementary Statistics: Picturing the World 8th Edition
Larson8th EditionElementary Statistics: Picturing the WorldISBN: 9780137493470Non è quello che usi tu?Cambia libro di testo
Capitolo 2, Problema 2.5.44

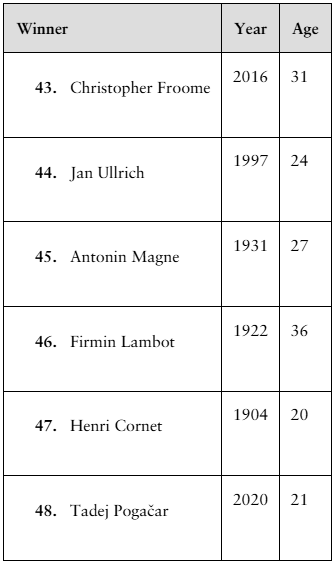
Finding z-Scores The distribution of the ages of the winners of the Tour de France from 1903 to 2020 is approximately bell-shaped. The mean age is 27.9 years, with a standard deviation of 3.4 years. In Exercises 43–48, use the corresponding z-score to determine whether the age is unusual. Explain your reasoning. (Source: Le Tour de France)


tab1

Guida verificata passo dopo passo
1
Step 1: Understand the z-score formula. The z-score is calculated using the formula: z=x-μσ, where x is the observed value, μ is the mean, and σ is the standard deviation.
Step 2: Identify the mean and standard deviation provided in the problem. The mean age (μ) is 27.9 years, and the standard deviation (σ) is 3.4 years.
Step 3: For each winner's age, substitute the values into the z-score formula. For example, for Christopher Froome (age 31), substitute x = 31, μ = 27.9, and σ = 3.4 into the formula.
Step 4: Calculate the z-score for each age. A z-score greater than 2 or less than -2 is considered unusual because it falls outside of 95% of the data in a normal distribution.
Step 5: Interpret the z-scores. For each winner, determine whether their age is unusual based on the calculated z-score. Provide reasoning for each case, explaining whether the age is within the typical range or considered unusual.

Risposta video verificata per un problema simile:

Questa soluzione video è stata consigliata dai nostri tutor come utile per risolvere questo problema.
Durata del video:
1m

Concetti chiave

Ecco i concetti essenziali che devi comprendere per rispondere correttamente alla domanda.

Z-Score

A z-score measures how many standard deviations an element is from the mean of a distribution. It is calculated by subtracting the mean from the value and then dividing by the standard deviation. A z-score can indicate whether a data point is typical or unusual within a given dataset, with values typically above 2 or below -2 considered unusual.
Video consigliato:
Percorso guidato
06:31
Z-Scores From Given Probability - TI-84 (CE) Calculator

Normal Distribution

A normal distribution is a bell-shaped probability distribution characterized by its mean and standard deviation. In a normal distribution, most of the data points cluster around the mean, and the probabilities for values further away from the mean taper off symmetrically. Understanding this concept is crucial for interpreting z-scores and determining the unusualness of data points.
Video consigliato:
Percorso guidato
06:23
Using the Normal Distribution to Approximate Binomial Probabilities

Standard Deviation

Standard deviation is a statistic that quantifies the amount of variation or dispersion in a set of values. A low standard deviation indicates that the values tend to be close to the mean, while a high standard deviation indicates that the values are spread out over a wider range. In the context of z-scores, the standard deviation is essential for determining how far a particular value is from the mean.
Video consigliato:
Percorso guidato
08:45
Calculating Standard Deviation
Pratica correlata
Domanda del libro di testo

Finding the Mean of a Frequency Distribution In Exercises 49–52, approximate the mean of the frequency distribution.


Social Media The average daily amounts of time (in minutes) spent on Snapchat

267
views

Domanda del libro di testo

Project Find a real-life data set and use the techniques of Chapter 2, including graphs and numerical quantities, to discuss the center, variation, and shape of the data set. Describe any patterns.

117
views
Domanda del libro di testo

What is the difference between a frequency polygon and an ogive?

418
views
Domanda del libro di testo

Finding and Interpreting Percentiles In Exercises 37– 40, use the data set, which represents wait times (in minutes) for various services at a state’s Department of Motor Vehicles locations.

6 10 1 22 23 10 6 7 2 1 6 6 2 4 14 15 16 4

19 3 19 26 5 3 4 7 6 10 9 10 20 18 3 20 10 13

14 11 14 17 4 27 4 8 4 3 26 18 21 1 3 3 5 5

Which wait time represents the 50th percentile? How would you interpret this?

280
views
Domanda del libro di testo

Finding a Weighted Mean In Exercises 41– 46, find the weighted mean of the data.


Grades A student receives the grades shown below, with an A worth 4 points, a B worth 3 points, a C worth 2 points, and a D worth 1 point. What is the student’s grade point average?


238
views
Domanda del libro di testo

Comparing Variation in Different Data Sets In Exercises 45–50, find the coefficient of variation for each of the two data sets. Then compare the results.

Annual Salaries Sample annual salaries (in thousands of dollars) for entry level architects in Denver, CO, and Los Angeles, CA, are listed.

156
views