


Ch. 2 - Descriptive Statistics
Larson - Elementary Statistics: Picturing the World 8th Edition
Larson8th EditionElementary Statistics: Picturing the WorldISBN: 9780137493470Non è quello che usi tu?Cambia libro di testo
Capitolo 2, Problema 2.1.3

What is the difference between class limits and class boundaries?

Guida verificata passo dopo passo
1
Class limits are the smallest and largest values that can belong to a particular class in a frequency distribution. For example, if a class is defined as 10-20, the lower class limit is 10 and the upper class limit is 20.
Class boundaries are the actual boundaries between classes, which are calculated to avoid gaps between adjacent classes. They are typically found by averaging the upper limit of one class and the lower limit of the next class. For example, if one class is 10-20 and the next class is 21-30, the class boundary between them would be (20 + 21) / 2 = 20.5.
Class limits are used to define the range of values that fall within a class, while class boundaries are used to ensure there are no gaps between classes in a frequency distribution.
Class boundaries are especially useful when creating histograms or other graphical representations of data, as they ensure continuity between classes.
To summarize, class limits are the defined endpoints of a class, while class boundaries are adjusted values that ensure smooth transitions between classes in a dataset.

Risposta video verificata per un problema simile:

Questa soluzione video è stata consigliata dai nostri tutor come utile per risolvere questo problema.
Durata del video:
57s

Concetti chiave

Ecco i concetti essenziali che devi comprendere per rispondere correttamente alla domanda.

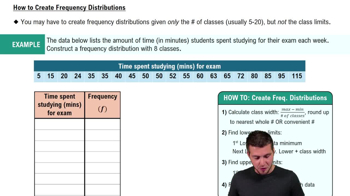
Class Limits

Class limits refer to the smallest and largest values that define a class interval in a frequency distribution. For example, in a class interval of 10-19, 10 is the lower class limit and 19 is the upper class limit. Class limits are used to group data into intervals for easier analysis and visualization.
Video consigliato:
Percorso guidato
06:29
How to Create Frequency Distributions

Class Boundaries

Class boundaries are the values that separate one class interval from another, ensuring there are no gaps between classes. They are calculated by taking the average of the upper limit of one class and the lower limit of the next class. For instance, the class boundaries for the interval 10-19 would be 9.5 and 19.5, allowing for continuous data representation.
Video consigliato:
Percorso guidato
07:10
How to Create Histogram - TI-84 Calculator

Frequency Distribution

A frequency distribution is a summary of how often each value or range of values occurs in a dataset. It organizes data into classes or intervals, showing the number of observations (frequency) within each class. Understanding frequency distributions is essential for interpreting data patterns and making statistical inferences.
Video consigliato:
Percorso guidato
06:38
Intro to Frequency Distributions
Pratica correlata
Domanda del libro di testo

Comparing z-Scores from Different Data Sets The table shows population statistics for the ages of Best Actor and Best Supporting Actor winners at the Academy Awards from 1929 to 2020. The distributions of the ages are approximately bell-shaped. In Exercises 51–54, compare the z-scores for the actors.


Best Actor 1970: John Wayne, Age: 62

Best Supporting Actor 1970: Gig Young, Age: 56

107
views
Domanda del libro di testo

Finding a Percentile In Exercises 33–36, use the data set, which represents the ages of 30 executives.

43 57 65 47 57 41 56 53 61 54

56 50 66 56 50 61 47 40 50 43

54 41 48 45 28 35 38 43 42 44


Which ages are above the 75th percentile?

421
views
Domanda del libro di testo

In Exercises 13 and 14, find the range, mean, variance, and standard deviation of the population data set.


Drunk Driving The number of alcohol-impaired crash fatalities (in thousands) per year from 2010 through 2019 (Source: National Highway Traffic Safety Administration)

10.1 9.9 10.3 10.1 9.9 10.3 11.0 10.9 10.7 10.1

119
views
Domanda del libro di testo

Graphing Data Sets In Exercises 17–32, organize the data using the indicated type of graph. Describe any patterns.


Nursing Use a stem-and-leaf plot to display the data, which represent the number of hours 24 nurses work per week. 

40 40 35 48 38 40 36 50 32 36 40 35

30 24 40 36 40 36 40 39 33 40 32 38

154
views
Domanda del libro di testo

Constructing a Frequency Distribution and a Relative Frequency Histogram In Exercises 37–40, construct a frequency distribution and a relative frequency histogram for the data set using five classes. Which class has the greatest relative frequency and which has the least relative frequency?

Taste Test

Data set: Ratings from 1 (lowest) to 10 (highest) provided by 36 people after taste-testing a new flavor of protein bar 2 6 9 2 9 9 6 10 5 8 7 6 5 10 1 4 9 3 4 5 3 6 5 2 4 9 2 9 3 3 6 5 1 9 4 2

261
views
Domanda del libro di testo

Finding z-Scores The distribution of the ages of the winners of the Tour de France from 1903 to 2020 is approximately bell-shaped. The mean age is 27.9 years, with a standard deviation of 3.4 years. In Exercises 43–48, use the corresponding z-score to determine whether the age is unusual. Explain your reasoning. (Source: Le Tour de France)

100
views