

Ch. 3 - Probability
Larson - Elementary Statistics: Picturing the World 8th Edition
Larson8th EditionElementary Statistics: Picturing the WorldISBN: 9780137493470Non è quello che usi tu?Cambia libro di testo
Capitolo 3, Problema 3.3.21b

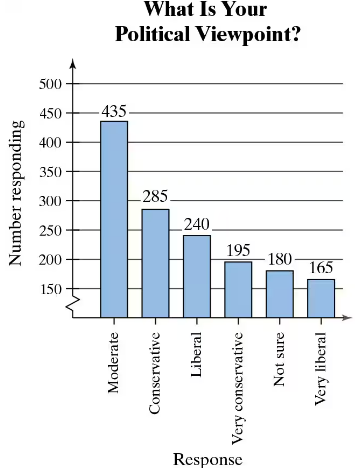
Politics The responses of 1500 U.S. adults to a survey that asked them to state their own political viewpoints are shown in the Pareto chart. Find the probability of each event.(Adapted from YouGov)
b. Randomly selecting a person from the sample who is conservative or very conservative
Bar graph showing survey results on political viewpoints, with 'Moderate' having the highest response at 435.

Guida verificata passo dopo passo
1
Step 1: Identify the total number of survey respondents. From the problem, we know that the total number of respondents is 1500.
Step 2: Determine the number of respondents who identify as 'Conservative' and 'Very Conservative' from the Pareto chart. From the chart, the number of 'Conservative' respondents is 285, and the number of 'Very Conservative' respondents is 195.
Step 3: Add the number of 'Conservative' and 'Very Conservative' respondents to find the total number of people in these categories. This gives us 285 + 195.
Step 4: Calculate the probability of randomly selecting a person who is 'Conservative' or 'Very Conservative' by dividing the total number of 'Conservative' and 'Very Conservative' respondents by the total number of survey respondents. Use the formula: \( P = \frac{\text{Number of Conservative and Very Conservative respondents}}{\text{Total respondents}} \).
Step 5: Simplify the fraction obtained in Step 4, if necessary, to express the probability in its simplest form or as a decimal.

Risposta video verificata per un problema simile:

Questa soluzione video è stata consigliata dai nostri tutor come utile per risolvere questo problema.
Durata del video:
3m

Concetti chiave

Ecco i concetti essenziali che devi comprendere per rispondere correttamente alla domanda.

Probability

Probability is a measure of the likelihood that a particular event will occur, expressed as a number between 0 and 1. In this context, it involves calculating the chance of randomly selecting a person from the survey who identifies as conservative or very conservative. This is done by dividing the number of individuals in those categories by the total number of respondents.
Video consigliato:
Percorso guidato
5:37
Introduction to Probability

Pareto Chart

A Pareto chart is a type of bar graph where the values are represented in descending order, highlighting the most significant factors in a dataset. In this case, the chart displays the political viewpoints of respondents, allowing for a quick visual assessment of which viewpoints are most common. Understanding how to read this chart is essential for interpreting the survey results.
Video consigliato:
Percorso guidato
04:52
Creating Bar Graphs and Pareto Charts

Categorical Data

Categorical data refers to variables that can be divided into distinct groups or categories, such as political viewpoints in this survey. Each category represents a different response type, and analyzing this data involves counting the number of responses in each category. This is crucial for determining the probability of selecting individuals from specific political groups.
Video consigliato:
Percorso guidato
4:01
Introduction to Collecting Data
Pratica correlata
Domanda del libro di testo

25. Working from Home The table shows the results of a survey that asked 1811 people how often they work from home. A person is selected at random from the sample. Find the probability of each event.

b. The person is female or does not work from home.

" style="" width="400">

85
views
Domanda del libro di testo

"Using the Multiplication Rule In Exercises 19-32, use the Multiplication Rule.

25. Best President In a sample of 1500 adult U.S. citizens, 270 said that Barack Obama was the best president in U.S. history. Two adult U.S. citizens are selected at random.

(Adapted from YouGov)

b. Find the probability that neither adult U.S. citizen says that Barack Obama was the best president in U.S. history."

50
views
Domanda del libro di testo

"Using the Multiplication Rule In Exercises 19-32, use the Multiplication Rule.

27. Blood Types The probability that a person of Asian descent in the United States has type O+ blood is 39%. At random, six people of Asian descent in the United States are selected. (Source: American National Red Cross)

b. Find the probability that none of the six have type O+ blood."

54
views
Domanda del libro di testo

"Using the Multiplication Rule In Exercises 19-32, use the Multiplication Rule.

24. Knowing a Person Who Was Murdered In a sample of 11,771 children ages 2 to 17, 8% have lost a friend or relative to murder. Four children are selected at random. (Adapted from University of New Hampshire)

b. Find the probability that none of the four has lost a friend or relative to murder."

61
views
Domanda del libro di testo

2. Determine whether each number could represent the probability of an event. Explain your reasoning. b. 333.3%

161
views
Domanda del libro di testo

Officers The offices of president, vice president, secretary, and treasurer for an environmental club will be filled from a pool of 14 candidates. Six of the candidates are members of the debate team.

b. What is the probability that none of the offices are filled by members of the debate team?

109
views