Ch. 5 - Normal Probability Distributions
Larson - Elementary Statistics: Picturing the World 8th Edition
Larson8th EditionElementary Statistics: Picturing the WorldISBN: 9780137493470Non è quello che usi tu?Cambia libro di testo
Capitolo 5, Problema 5.1.42

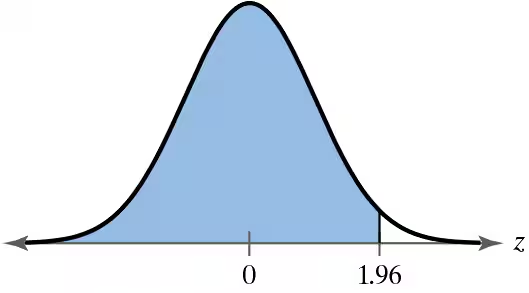
Finding Probability In Exercises 41–46, find the probability of z occurring in the shaded region of the standard normal distribution. If convenient, use technology to find the probability.


Standard normal distribution curve with a shaded area representing the probability of z between 0 and 1.96.

Guida verificata passo dopo passo
1
Step 1: Understand the problem. The goal is to find the probability of z occurring in the shaded region of the standard normal distribution. The shaded region is between z = 0 and z = 1.96.
Step 2: Recall that the standard normal distribution has a mean of 0 and a standard deviation of 1. The z-scores represent the number of standard deviations away from the mean.
Step 3: Use the cumulative probability function for the standard normal distribution to find the area under the curve from z = 0 to z = 1.96. This can be done using statistical tables (z-tables) or technology such as a calculator or software.
Step 4: Look up the cumulative probability for z = 1.96 in the z-table or calculate it using technology. This value represents the area under the curve from z = -∞ to z = 1.96.
Step 5: Subtract the cumulative probability for z = 0 (which is 0.5, as it is the midpoint of the standard normal distribution) from the cumulative probability for z = 1.96 to find the probability of z occurring in the shaded region.

Risposta video verificata per un problema simile:

Questa soluzione video è stata consigliata dai nostri tutor come utile per risolvere questo problema.
Durata del video:
1m

Concetti chiave

Ecco i concetti essenziali che devi comprendere per rispondere correttamente alla domanda.

Standard Normal Distribution

The standard normal distribution is a special case of the normal distribution where the mean is 0 and the standard deviation is 1. It is represented by the z-score, which indicates how many standard deviations an element is from the mean. The area under the curve represents probabilities, with the total area equaling 1.
Video consigliato:
Percorso guidato
09:47
Finding Standard Normal Probabilities using z-Table

Z-Score

A z-score is a statistical measurement that describes a value's relationship to the mean of a group of values. It is calculated by subtracting the mean from the value and then dividing by the standard deviation. In the context of the standard normal distribution, z-scores allow us to determine the probability of a value falling within a certain range.
Video consigliato:
Percorso guidato
06:31
Z-Scores From Given Probability - TI-84 (CE) Calculator

Probability and Area Under the Curve

In statistics, the probability of a z-score occurring within a certain range in the standard normal distribution is represented by the area under the curve for that range. This area can be calculated using z-tables or technology, and it reflects the likelihood of a random variable falling within that specified range.
Video consigliato:
Percorso guidato
08:50
Z-Scores from Probabilities
Pratica correlata
Domanda del libro di testo

In Exercises 9–14, write the binomial probability in words. Then, use a continuity correction to convert the binomial probability to a normal distribution probability.


P(55 < x < 60)

191
views

Domanda del libro di testo

Testing a Drug A drug manufacturer claims that a drug cures a rare skin disease 75% of the time. The claim is checked by testing the drug on 100 patients. If at least 70 patients are cured, then this claim will be accepted. Use this information in Exercises 31 and 32.


Find the probability that the claim will be rejected, assuming that the manufacturer’s claim is true.

49
views
Domanda del libro di testo

In Exercises 5–8, match the binomial probability statement with its corresponding normal distribution probability statement (a)–(d) after a continuity correction.

P(x<109)


a. P(x>109.5)

b. P(x<108.5)

c. P(x<109.5)

d. P(x>108.5)

156
views
Domanda del libro di testo

Finding Area

In Exercises 23–36, find the indicated area under the standard normal curve. If convenient, use technology to find the area.


To the right of z= -0.355

85
views
Domanda del libro di testo

Milk Containers A machine is set to fill milk containers with a mean of 64 ounces and a standard deviation of 0.11 ounce. A random sample of 40 containers has a mean of 64.05 ounces. The machine needs to be reset when the mean of a random sample is unusual. Does the machine need to be reset? Explain.

53
views
Domanda del libro di testo

In Exercises 9–14, write the binomial probability in words. Then, use a continuity correction to convert the binomial probability to a normal distribution probability.


P(x ≥ 110)

112
views