Ch. 6 - Confidence Intervals
Larson - Elementary Statistics: Picturing the World 8th Edition
Larson8th EditionElementary Statistics: Picturing the WorldISBN: 9780137493470Non è quello che usi tu?Cambia libro di testo
Capitolo 6, Problema 6.3.12

Constructing Confidence Intervals In Exercises 11 and 12, construct 90% and 95% confidence intervals for the population proportion. Interpret the results and compare the widths of the confidence intervals.
New Year’s Resolutions In a survey of 1790 U.S. adults in a recent year, 816 have a New Year’s resolution related to their health. (Adapted from Finder)

Guida verificata passo dopo passo
1
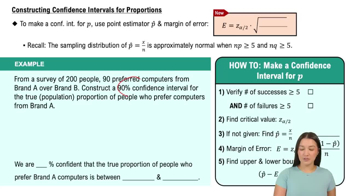
Step 1: Identify the sample proportion (p̂) and the sample size (n). The sample proportion is calculated as p̂ = x / n, where x is the number of successes (816) and n is the total sample size (1790).
Step 2: Determine the critical z-scores for the desired confidence levels. For a 90% confidence interval, the critical z-score is approximately 1.645. For a 95% confidence interval, the critical z-score is approximately 1.96.
Step 3: Calculate the standard error (SE) of the sample proportion using the formula SE = sqrt((p̂ * (1 - p̂)) / n).
Step 4: Construct the confidence intervals using the formula: CI = p̂ ± (z * SE), where z is the critical z-score for the desired confidence level. Perform this calculation separately for the 90% and 95% confidence levels.
Step 5: Compare the widths of the confidence intervals. The width of a confidence interval is given by 2 * (z * SE). Note that the 95% confidence interval will be wider than the 90% confidence interval because a higher confidence level requires a larger margin of error.

Risposta video verificata per un problema simile:

Questa soluzione video è stata consigliata dai nostri tutor come utile per risolvere questo problema.
Durata del video:
6m

Concetti chiave

Ecco i concetti essenziali che devi comprendere per rispondere correttamente alla domanda.

Confidence Interval

A confidence interval is a range of values, derived from sample statistics, that is likely to contain the true population parameter with a specified level of confidence, such as 90% or 95%. It provides an estimate of uncertainty around the sample proportion, indicating how much the sample result might vary if different samples were taken.
Video consigliato:
Percorso guidato
06:33
Introduction to Confidence Intervals

Population Proportion

The population proportion is the ratio of members of a population that have a particular characteristic, expressed as a fraction or percentage. In this context, it refers to the proportion of U.S. adults who have a New Year’s resolution related to their health, which is estimated from the sample data.
Video consigliato:
Percorso guidato
05:45
Constructing Confidence Intervals for Proportions

Width of Confidence Intervals

The width of a confidence interval reflects the precision of the estimate; narrower intervals indicate more precise estimates of the population parameter. The width is influenced by the sample size and the confidence level chosen; higher confidence levels result in wider intervals, while larger sample sizes yield narrower intervals, allowing for more accurate estimates.
Video consigliato:
Percorso guidato
06:33
Introduction to Confidence Intervals
Pratica correlata
Domanda del libro di testo

Graphical Analysis In Exercises 9–12, use the values on the number line to find the sampling error.

77
views

Domanda del libro di testo

In Exercises 5–8, find the critical value zc necessary to construct a confidence interval at the level of confidence c.

c = 0.80

110
views
Domanda del libro di testo

Finding Critical Values for χ2 In Exercises 3–8, find the critical values χR2 and χL2 for the level of confidence c and sample size n.

c = 0.95, n = 20

42
views
Domanda del libro di testo

You research prices of cell phones and find that the population mean is \$431.61. In Exercise 19, does the t-value fall between -t0.95 and t0.95?

71
views
Domanda del libro di testo

Finding p^ and q^ In Exercises 3–6, let p be the population proportion for the situation. Find point estimates of p and q.

Private Internet Browsing In a survey of 4272 U.S. adults, 1025 knew that private browsing mode only prevents someone using the same computer from seeing one’s online activities. (Adapted from Pew Research Center)

103
views
Domanda del libro di testo

In Exercises 35–40, use the standard normal distribution or the t-distribution to construct a 95% confidence interval for the population mean. Justify your decision. If neither distribution can be used, explain why. Interpret the results.

The population standard deviation of the weights of the two-year-old males on a pediatrician’s patient list is 2.49 pounds. The mean weight of a sample of 10 of the two–year–old males is 13.68 pounds. Weights are known to be normally distributed.

85
views