


Ch. 6 - Confidence Intervals
Larson - Elementary Statistics: Picturing the World 8th Edition
Larson8th EditionElementary Statistics: Picturing the WorldISBN: 9780137493470Non è quello che usi tu?Cambia libro di testo
Capitolo 6, Problema 6.1.10

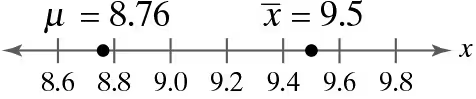
Graphical Analysis In Exercises 9–12, use the values on the number line to find the sampling error.
Number line showing population mean (μ = 8.76) and sample mean (x̄ = 9.5) with marked points for analysis.

Guida verificata passo dopo passo
1
Step 1: Understand the concept of sampling error. Sampling error is the difference between the sample mean (x̄) and the population mean (μ). It is calculated as: Samplingerror=x̄-μ.
Step 2: Identify the values provided in the problem. From the number line, the population mean (μ) is given as 8.76, and the sample mean (x̄) is given as 9.5.
Step 3: Substitute the values into the formula for sampling error. Replace μ with 8.76 and x̄ with 9.5 in the formula: Samplingerror=9.5-8.76.
Step 4: Perform the subtraction operation to find the sampling error. This step involves calculating the difference between the sample mean and the population mean.
Step 5: Interpret the result. The sampling error represents how much the sample mean deviates from the population mean, which can provide insights into the accuracy of the sample in representing the population.

Risposta video verificata per un problema simile:

Questa soluzione video è stata consigliata dai nostri tutor come utile per risolvere questo problema.
Durata del video:
1m

Concetti chiave

Ecco i concetti essenziali che devi comprendere per rispondere correttamente alla domanda.

Population Mean (μ)

The population mean, denoted as μ, is the average of all values in a population. It serves as a central point around which data points are distributed. In the context of the question, μ is given as 8.76, indicating the expected average value of the entire population from which a sample is drawn.
Video consigliato:
Percorso guidato
04:48
Population Standard Deviation Known

Sample Mean (x̄)

The sample mean, represented as x̄, is the average of values in a sample taken from the population. It provides an estimate of the population mean based on the data collected. In this case, x̄ is 9.5, which suggests that the sample's average is higher than the population mean, indicating potential sampling variability.
Video consigliato:
Percorso guidato
05:11
Sampling Distribution of Sample Proportion

Sampling Error

Sampling error refers to the difference between the sample mean (x̄) and the population mean (μ). It quantifies how much the sample mean deviates from the true population mean due to random sampling. In this scenario, the sampling error can be calculated as x̄ - μ, which helps assess the accuracy of the sample in representing the population.
Video consigliato:
Percorso guidato
05:11
Sampling Distribution of Sample Proportion