Ch. 6 - Confidence Intervals
Larson - Elementary Statistics: Picturing the World 8th Edition
Larson8th EditionElementary Statistics: Picturing the WorldISBN: 9780137493470Non è quello che usi tu?Cambia libro di testo
Capitolo 6, Problema 6.3.1

True or False? In Exercises 1 and 2, determine whether the statement is true or false. If it is false, rewrite it as a true statement.
The point estimate for the population proportion of failures is 1-p^

Guida verificata passo dopo passo
1
Understand the problem: The statement is about the point estimate for the population proportion of failures. Recall that the population proportion of successes is denoted by p, and the population proportion of failures is complementary to this, represented as 1 - p.
Review the concept: The point estimate for the population proportion of failures is derived from the complement of the population proportion of successes. If p represents the proportion of successes, then 1 - p represents the proportion of failures.
Analyze the statement: The statement claims that the point estimate for the population proportion of failures is 1 - p^ (where p^ is the sample proportion of successes). This aligns with the definition of the complement rule in probability.
Determine the truth value: Since the statement correctly describes the relationship between the sample proportion of successes (p^) and the sample proportion of failures (1 - p^), the statement is true.
Conclude: The statement is true, and no rewriting is necessary. If the statement were false, you would need to correct it by ensuring the complement relationship is properly stated as 1 - p^ for the sample proportion of failures.

Risposta video verificata per un problema simile:

Questa soluzione video è stata consigliata dai nostri tutor come utile per risolvere questo problema.
Durata del video:
1m

Concetti chiave

Ecco i concetti essenziali che devi comprendere per rispondere correttamente alla domanda.

Point Estimate

A point estimate is a single value that serves as an approximation of a population parameter. In statistics, it is often derived from sample data and is used to infer characteristics about the entire population. For example, the sample mean is a point estimate of the population mean.
Video consigliato:
Percorso guidato
06:33
Introduction to Confidence Intervals

Population Proportion

The population proportion refers to the fraction of a population that possesses a certain characteristic. It is denoted by 'p' and is crucial in understanding the distribution of categorical data. For instance, if 30 out of 100 surveyed individuals prefer a certain product, the population proportion of preference is 0.3.
Video consigliato:
Percorso guidato
05:45
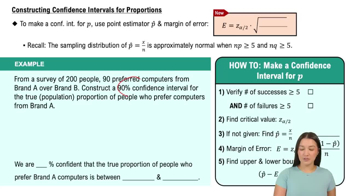
Constructing Confidence Intervals for Proportions

Complement of a Proportion

The complement of a proportion is the probability that an event does not occur, calculated as 1 minus the proportion of the event. In the context of failures, if 'p' represents the proportion of successes, then '1 - p' represents the proportion of failures. This concept is essential for accurately interpreting and calculating probabilities in statistical analysis.
Video consigliato:
Percorso guidato
08:09
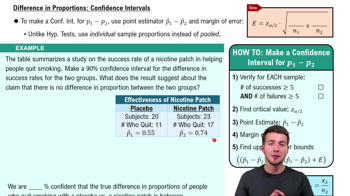
Difference in Proportions: Confidence Intervals