


Ch. 9 - Correlation and Regression
Larson - Elementary Statistics: Picturing the World 8th Edition
Larson8th EditionElementary Statistics: Picturing the WorldISBN: 9780137493470Non è quello che usi tu?Cambia libro di testo
Capitolo 9, Problema 9.2.5

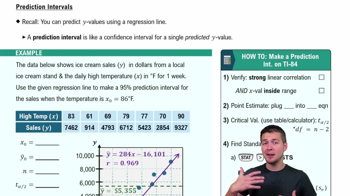
5. To predict y-values using the equation of a regression line, what must be true about the correlation coefficient of the variables?

Guida verificata passo dopo passo
1
Understand the concept of the correlation coefficient: The correlation coefficient (denoted as r) measures the strength and direction of the linear relationship between two variables. It ranges from -1 to 1, where values close to -1 or 1 indicate a strong linear relationship, and values near 0 indicate a weak or no linear relationship.
Recognize the role of the regression line: The regression line is used to predict y-values based on x-values. For the predictions to be meaningful, there must be a significant linear relationship between the variables.
Ensure the correlation coefficient is not zero: If the correlation coefficient is close to zero, it implies that there is little to no linear relationship between the variables, making the regression line ineffective for prediction.
Check the strength of the correlation: A higher absolute value of the correlation coefficient (e.g., |r| > 0.7) indicates a stronger linear relationship, which makes the regression line more reliable for predicting y-values.
Verify the direction of the relationship: If r is positive, the regression line will have a positive slope, meaning y increases as x increases. If r is negative, the regression line will have a negative slope, meaning y decreases as x increases. This direction must align with the data for accurate predictions.

Risposta video verificata per un problema simile:

Questa soluzione video è stata consigliata dai nostri tutor come utile per risolvere questo problema.
Durata del video:
2m

Concetti chiave

Ecco i concetti essenziali che devi comprendere per rispondere correttamente alla domanda.

Correlation Coefficient

The correlation coefficient, denoted as 'r', quantifies the strength and direction of a linear relationship between two variables. It ranges from -1 to 1, where values close to 1 indicate a strong positive correlation, values close to -1 indicate a strong negative correlation, and values around 0 suggest no linear correlation. Understanding this coefficient is crucial for assessing how well one variable can predict another in regression analysis.
Video consigliato:
Percorso guidato
05:43
Correlation Coefficient

Regression Line

A regression line is a statistical tool used to model the relationship between a dependent variable (y) and one or more independent variables (x). It is represented by the equation y = mx + b, where 'm' is the slope and 'b' is the y-intercept. The accuracy of predictions made using this line is heavily influenced by the correlation coefficient, as a strong correlation indicates that the regression line will closely fit the data points.
Video consigliato:
Percorso guidato
04:57
Using Regression Lines to Predict Values

Predictive Validity

Predictive validity refers to the extent to which a model, such as a regression line, accurately predicts outcomes based on input variables. For the predictions to be reliable, the correlation coefficient must be significantly different from zero, indicating a meaningful relationship between the variables. High predictive validity ensures that changes in the independent variable lead to consistent changes in the dependent variable, making the model useful for forecasting.
Video consigliato:
Percorso guidato
09:00
Prediction Intervals