


Ch. 9 - Correlation and Regression
Larson - Elementary Statistics: Picturing the World 8th Edition
Larson8th EditionElementary Statistics: Picturing the WorldISBN: 9780137493470Non è quello che usi tu?Cambia libro di testo
Capitolo 9, Problema 9.3.33

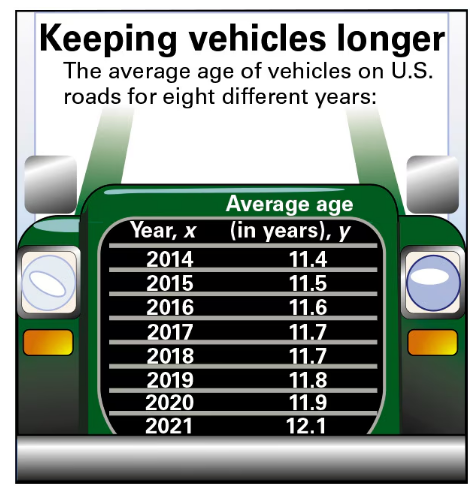
"Old Vehicles In Exercises 31–34, use the figure shown at the left.

33. Coefficient of Determination Find the coefficient of determination r^2 and interpret the results."

Guida verificata passo dopo passo
1
Step 1: Identify the variables and data points. Here, the independent variable (x) is the year, and the dependent variable (y) is the average age of vehicles. The data points are given for years 2014 to 2021 with corresponding average ages.
Step 2: Calculate the correlation coefficient (r) between the year (x) and the average age (y). This involves finding the covariance of x and y, and dividing it by the product of their standard deviations. The formula is: r = cov(x,y)var(x)⋅var(y).
Step 3: Once you have the correlation coefficient r, calculate the coefficient of determination r² by squaring r. This value represents the proportion of the variance in the dependent variable (average age) that is predictable from the independent variable (year).
Step 4: Interpret the coefficient of determination r². A value close to 1 indicates a strong linear relationship where the year explains most of the variation in average vehicle age. A value close to 0 indicates a weak relationship.
Step 5: Summarize your findings by stating how well the year predicts the average age of vehicles based on the calculated r² value.

Risposta video verificata per un problema simile:

Questa soluzione video è stata consigliata dai nostri tutor come utile per risolvere questo problema.
Durata del video:
3m

Concetti chiave

Ecco i concetti essenziali che devi comprendere per rispondere correttamente alla domanda.

Coefficient of Determination (r²)

The coefficient of determination, denoted as r², measures the proportion of the variance in the dependent variable that is predictable from the independent variable. It ranges from 0 to 1, where a higher value indicates a better fit of the regression model to the data. In this context, it shows how well the year explains changes in the average vehicle age.
Video consigliato:
Percorso guidato
06:14
Coefficient of Determination

Linear Regression

Linear regression is a statistical method used to model the relationship between a dependent variable and one or more independent variables by fitting a linear equation. Here, it helps to analyze how the average age of vehicles changes over the years, providing a basis to calculate r² and interpret trends.
Video consigliato:
Percorso guidato
07:01
Intro to Least Squares Regression

Interpretation of Statistical Results

Interpreting statistical results involves understanding what the calculated values imply in real-world terms. For r², this means explaining how much of the variation in vehicle age is explained by the year, which helps in assessing trends and making informed conclusions about vehicle longevity over time.
Video consigliato:
Percorso guidato
07:10
Empirical Rule of Standard Deviation and Range Rule of Thumb
Pratica correlata
Domanda del libro di testo

"Predicting y-Values In Exercises 3-6, use the multiple regression equation to predict the y-values for the values of the independent variables.

6. Elephant Weight The equation used to predict the weight of an elephant (in kilograms) is

y =- 4016+11.5x_1+7.55x_2+12.5x_3

where x_1 represents the girth of the elephant (in centimeters), x_2 represents the length of the elephant (in centimeters), and x_3 represents the circumference of a footpad (in

centimeters). (Source: Field Trip Earth)

a. x_1 = 421, x_2 = 224, x_3 = 144

b. x_1 = 311, x_2 = 171, x_3 = 102

c. x_1 = 376, x_2 = 226, x_3 = 124

d. x_1 =231, x_2 = 135, x_3 = 86"

36
views
Domanda del libro di testo

6. Discuss the difference between r and p.

331
views
Domanda del libro di testo

5. To predict y-values using the equation of a regression line, what must be true about the correlation coefficient of the variables?

119
views
Domanda del libro di testo

2. Describe the range of values for the correlation coefficient.

248
views
Domanda del libro di testo

"In Exercises 19-22, two variables are given that have been shown to have correlation but no cause-and-effect relationship. Describe at least one possible reason for the correlation.

22. Marriage rate in Kentucky and number of deaths caused by falling out of a fishing boat"

65
views
Domanda del libro di testo

"In Exercises 7-12, match the description in the left column with its symbol(s) in the right column.

12. The point a regression line always passes through

a. \(\hat{y}\)_i

b. y_i

c. b

d. (\(\bar{x}\), \(\bar{y}\))

e. m

f. \(\bar{y}\)"

51
views