Ch. 9 - Correlation and Regression
Larson - Elementary Statistics: Picturing the World 8th Edition
Larson8th EditionElementary Statistics: Picturing the WorldISBN: 9780137493470Non è quello che usi tu?Cambia libro di testo
Capitolo 9, Problema 9.3.21

"Constructing and Interpreting a Prediction Interval In Exercises 21-30, construct the indicated prediction interval and interpret the results.
21. Proceeds Construct a 95% prediction interval for the proceeds from initial public offerings in Exercise 11 when the number of offerings is 200."

Guida verificata passo dopo passo
1
Identify the regression model from Exercise 11, including the estimated regression equation and the standard error of the estimate (often denoted as \( s \) or \( s_e \)). This model relates the number of offerings to the proceeds.
Calculate the predicted value \( \hat{y} \) for the number of offerings \( x = 200 \) by substituting \( x = 200 \) into the regression equation: \( \hat{y} = b_0 + b_1 \times 200 \), where \( b_0 \) is the intercept and \( b_1 \) is the slope.
Determine the critical value \( t^* \) from the t-distribution for a 95% prediction interval, using the appropriate degrees of freedom (usually \( n - 2 \), where \( n \) is the sample size from Exercise 11).
Calculate the standard error of the prediction interval using the formula: \[ SE_{pred} = s \sqrt{1 + \frac{1}{n} + \frac{(200 - \bar{x})^2}{\sum (x_i - \bar{x})^2}} \], where \( \bar{x} \) is the mean of the \( x \)-values and \( \sum (x_i - \bar{x})^2 \) is the sum of squared deviations of the \( x \)-values.
Construct the 95% prediction interval using the formula: \[ \hat{y} \pm t^* \times SE_{pred} \]. Interpret this interval as the range in which we expect the proceeds from 200 offerings to fall with 95% confidence, considering both the uncertainty in the regression and the variability of individual observations.

Risposta video verificata per un problema simile:

Questa soluzione video è stata consigliata dai nostri tutor come utile per risolvere questo problema.
Durata del video:
5m

Concetti chiave

Ecco i concetti essenziali che devi comprendere per rispondere correttamente alla domanda.

Prediction Interval

A prediction interval estimates the range within which a single future observation is expected to fall, with a specified level of confidence. Unlike confidence intervals for the mean, prediction intervals account for both the variability in the estimate and the inherent randomness of individual outcomes.
Video consigliato:
Percorso guidato
09:00
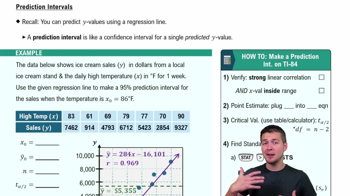
Prediction Intervals

Confidence Level

The confidence level, such as 95%, indicates the probability that the prediction interval contains the true future value. It reflects the degree of certainty in the interval estimate, meaning that if the process were repeated many times, 95% of such intervals would capture the actual outcome.
Video consigliato:
Percorso guidato
06:33
Introduction to Confidence Intervals

Application to Regression or Forecasting

Constructing a prediction interval often involves using a regression model or historical data to forecast future values. Understanding how to apply the model to a specific input (e.g., 200 offerings) and incorporate variability is essential to accurately estimate the interval and interpret its meaning.
Video consigliato:
Percorso guidato
07:01
Intro to Least Squares Regression