


Ch. 10 - Correlation and Regression
Triola - Elementary Statistics 14th Edition
Triola14th EditionElementary StatisticsISBN: 9780137366446Non è quello che usi tu?Cambia libro di testo
Capitolo 10, Problema 10.1.6

Interpreting r
In Exercises 5–8, use a significance level of α = 0.05 and refer to the accompanying displays.
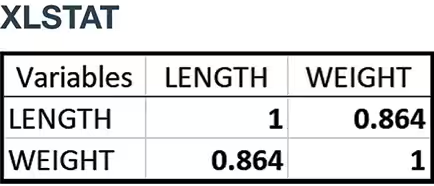
Bear Length and Weight The lengths (inches) and weights (pounds) of 54 bears are obtained from Data Set 18 “Bear Measurements” in Appendix B, and results are shown in the accompanying XLSTAT display. Is there sufficient evidence to support the claim that there is a linear correlation between length and weight?

Guida verificata passo dopo passo
1
Step 1: Identify the correlation coefficient (r) from the provided XLSTAT display. The correlation coefficient between LENGTH and WEIGHT is given as 0.864.
Step 2: State the null hypothesis (H₀) and the alternative hypothesis (H₁). H₀: There is no linear correlation between LENGTH and WEIGHT (r = 0). H₁: There is a linear correlation between LENGTH and WEIGHT (r ≠ 0).
Step 3: Determine the significance level (α). The problem specifies α = 0.05, which is the threshold for deciding whether to reject the null hypothesis.
Step 4: Use the sample size (n = 54) and the correlation coefficient (r = 0.864) to calculate the test statistic. The formula for the test statistic is t = r * sqrt((n - 2) / (1 - r²)). Substitute the values into the formula to compute t.
Step 5: Compare the calculated t-value to the critical t-value from the t-distribution table with degrees of freedom (df = n - 2 = 54 - 2 = 52) at α = 0.05. If the calculated t-value exceeds the critical t-value, reject the null hypothesis and conclude that there is sufficient evidence to support the claim of a linear correlation between LENGTH and WEIGHT.

Risposta video verificata per un problema simile:

Questa soluzione video è stata consigliata dai nostri tutor come utile per risolvere questo problema.
Durata del video:
6m

Concetti chiave

Ecco i concetti essenziali che devi comprendere per rispondere correttamente alla domanda.

Correlation Coefficient (r)

The correlation coefficient, denoted as 'r', quantifies the strength and direction of a linear relationship between two variables. It ranges from -1 to 1, where values close to 1 indicate a strong positive correlation, values close to -1 indicate a strong negative correlation, and values around 0 suggest no linear correlation. In this case, an r value of 0.864 suggests a strong positive correlation between bear length and weight.
Video consigliato:
Percorso guidato
05:43
Correlation Coefficient

Significance Level (α)

The significance level, often denoted as α, is a threshold used in hypothesis testing to determine whether to reject the null hypothesis. A common significance level is 0.05, which implies that there is a 5% risk of concluding that a correlation exists when there is none. In this context, it will help assess whether the observed correlation between length and weight is statistically significant.
Video consigliato:
Percorso guidato
04:46
Step 4: State Conclusion Example 4

Hypothesis Testing

Hypothesis testing is a statistical method used to make inferences about a population based on sample data. It involves formulating a null hypothesis (no correlation) and an alternative hypothesis (there is a correlation), then using statistical tests to determine if the data provides sufficient evidence to reject the null hypothesis. In this scenario, the goal is to evaluate if the correlation between bear length and weight is statistically significant at the α = 0.05 level.
Video consigliato:
Percorso guidato
06:21
Step 1: Write Hypotheses