


Ch. 11 - Goodness-of-Fit and Contingency Tables
Triola - Elementary Statistics 14th Edition
Triola14th EditionElementary StatisticsISBN: 9780137366446Non è quello che usi tu?Cambia libro di testo
Capitolo 11, Problema 11.q.9

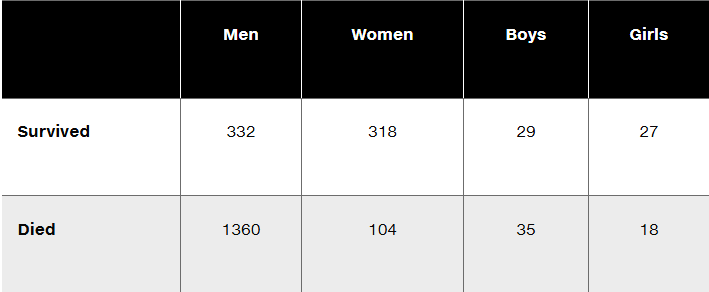
Questions 6–10 refer to the sample data in the following table, which describes the fate of the passengers and crew aboard the Titanic when it sank on April 15, 1912. Assume that the data are a sample from a large population and we want to use a 0.05 significance level to test the claim that surviving is independent of whether the person is a man, woman, boy, or girl.


Table showing Titanic survival data: Men (332 survived, 1360 died), Women (318 survived, 104 died), Boys (29 survived, 35 died), Girls (27 survived, 18 died).


Find the number of degrees of freedom.

Guida verificata passo dopo passo
1
Step 1: Understand the problem. The goal is to determine the number of degrees of freedom for a chi-square test of independence. Degrees of freedom are calculated based on the number of rows and columns in the contingency table.
Step 2: Identify the dimensions of the contingency table. The table has 2 rows (Survived and Died) and 4 columns (Men, Women, Boys, Girls).
Step 3: Use the formula for degrees of freedom in a chi-square test: \( \text{Degrees of Freedom} = (\text{Number of Rows} - 1) \times (\text{Number of Columns} - 1) \).
Step 4: Substitute the values into the formula. The number of rows is 2, and the number of columns is 4. Therefore, \( \text{Degrees of Freedom} = (2 - 1) \times (4 - 1) \).
Step 5: Simplify the expression to find the degrees of freedom. Perform the subtraction and multiplication: \( \text{Degrees of Freedom} = 1 \times 3 \).

Risposta video verificata per un problema simile:

Questa soluzione video è stata consigliata dai nostri tutor come utile per risolvere questo problema.
Durata del video:
1m

Concetti chiave

Ecco i concetti essenziali che devi comprendere per rispondere correttamente alla domanda.

Degrees of Freedom

Degrees of freedom (df) refer to the number of independent values or quantities that can vary in a statistical calculation. In the context of a chi-square test, which is likely applicable here, the degrees of freedom are calculated as the product of the number of categories minus one. For a contingency table, this is typically (rows - 1) * (columns - 1).
Video consigliato:
Percorso guidato
05:50
Critical Values: t-Distribution

Chi-Square Test of Independence

The chi-square test of independence is a statistical method used to determine if there is a significant association between two categorical variables. In this case, it assesses whether survival is independent of gender. The test compares the observed frequencies in each category to the frequencies expected if there were no association, using the chi-square statistic.
Video consigliato:
Percorso guidato
05:54
Probability of Multiple Independent Events

Significance Level

The significance level, often denoted as alpha (α), is the threshold for determining whether a statistical result is significant. A common significance level is 0.05, which indicates a 5% risk of concluding that a difference exists when there is none. In hypothesis testing, if the p-value is less than α, the null hypothesis is rejected, suggesting a significant association between the variables.
Video consigliato:
Percorso guidato
04:46
Step 4: State Conclusion Example 4