


Ch. 8 - Hypothesis Testing
Triola - Elementary Statistics 14th Edition
Triola14th EditionElementary StatisticsISBN: 9780137366446Non è quello che usi tu?Cambia libro di testo
Capitolo 8, Problema 8.2.33

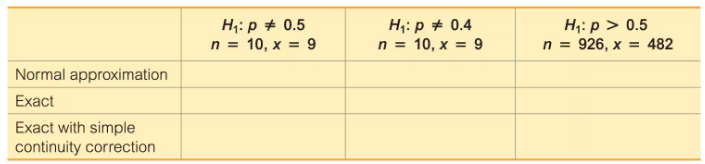
Exact Method For each of the three different methods of hypothesis testing (identified in the left column), enter the P-values corresponding to the given alternative hypothesis and sample data. Use a 0.05 significance level. Note that the entries in the last column correspond to the Chapter Problem. How do the results agree with the large sample size?
Table for entering P-values for three hypothesis tests with different sample sizes and alternative hypotheses.

Guida verificata passo dopo passo
1
Step 1: Identify the hypothesis for each scenario. For example, in the first column, the null hypothesis is H₀: p = 0.5, and the alternative hypothesis is H₁: p ≠ 0.5. Similarly, interpret the hypotheses for the other columns.
Step 2: Calculate the test statistic for each method. For the Normal approximation, use the formula for the z-score: z = (x - np) / sqrt(np(1-p)), where x is the number of successes, n is the sample size, and p is the hypothesized proportion. For the Exact method, use the binomial probability formula. For the Exact method with continuity correction, adjust the x value by ±0.5 before calculating the z-score.
Step 3: Determine the P-value for each test statistic. For the Normal approximation, use the z-score to find the P-value from the standard normal distribution table. For the Exact method, calculate the cumulative probability using the binomial distribution. For the Exact method with continuity correction, use the adjusted z-score to find the P-value.
Step 4: Compare the P-values to the significance level (α = 0.05). If the P-value is less than 0.05, reject the null hypothesis; otherwise, fail to reject the null hypothesis.
Step 5: Analyze the results for the large sample size (third column). Note that as the sample size increases, the Normal approximation becomes more accurate, and the differences between the methods (Exact, Normal approximation, and Exact with continuity correction) diminish.

Risposta video verificata per un problema simile:

Questa soluzione video è stata consigliata dai nostri tutor come utile per risolvere questo problema.
Durata del video:
3m

Concetti chiave

Ecco i concetti essenziali che devi comprendere per rispondere correttamente alla domanda.

Hypothesis Testing

Hypothesis testing is a statistical method used to make decisions about population parameters based on sample data. It involves formulating a null hypothesis (H0) and an alternative hypothesis (H1), then using sample data to calculate a test statistic and corresponding P-value. The P-value indicates the strength of evidence against the null hypothesis, helping to determine whether to reject H0 at a specified significance level.
Video consigliato:
Percorso guidato
06:21
Step 1: Write Hypotheses

P-value

The P-value is a measure that helps determine the significance of results in hypothesis testing. It represents the probability of observing the sample data, or something more extreme, assuming the null hypothesis is true. A smaller P-value indicates stronger evidence against the null hypothesis, and if it is less than the significance level (e.g., 0.05), the null hypothesis is typically rejected.
Video consigliato:
Percorso guidato
06:50
Step 3: Get P-Value

Normal Approximation vs. Exact Methods

Normal approximation methods are used in hypothesis testing when sample sizes are large enough for the Central Limit Theorem to apply, allowing the sampling distribution to be approximated by a normal distribution. In contrast, exact methods, such as the binomial test, are used for smaller sample sizes or when the normal approximation may not be valid. The choice of method can affect the calculated P-values and the conclusions drawn from the hypothesis tests.
Video consigliato:
Percorso guidato
06:23
Using the Normal Distribution to Approximate Binomial Probabilities
Pratica correlata
Domanda del libro di testo

Interpreting P-value The Ericsson method is one of several methods claimed to increase the likelihood of a baby girl. In a clinical trial, results could be analyzed with a formal hypothesis test with the alternative hypothesis of p > 0.5 which corresponds to the claim that the method increases the likelihood of having a girl, so that the proportion of girls is greater than 0.5. If you have an interest in establishing the success of the method, which of the following P-values would you prefer as a result in your hypothesis test: 0.999, 0.5, 0.95, 0.05, 0.01, 0.001? Why?

188
views
Domanda del libro di testo

Final Conclusions

In Exercises 21–24, use a significance level of α = 0.05 and use the given information for the following:


State a conclusion about the null hypothesis. (Reject H0 or fail to reject H0.)

Without using technical terms or symbols, state a final conclusion that addresses the original claim


Original claim: More than 35% of air travelers would choose another airline to have access to inflight Wi-Fi. The hypothesis test results in a P-value of 0.00001.

165
views
Domanda del libro di testo

Testing Claims About Variation

In Exercises 5–16, test the given claim. Identify the null hypothesis, alternative hypothesis, test statistic, P-value, or critical value(s), then state the conclusion about the null hypothesis, as well as the final conclusion that addresses the original claim. Assume that a simple random sample is selected from a normally distributed population.


Birth Weights A simple random sample of birth weights of 30 girls has a standard deviation of 829.5 g. Use a 0.01 significance level to test the claim that birth weights of girls have the same standard deviation as birth weights of boys, which is 660.2 g (based on Data Set 6 “Births” in Appendix B).

116
views
Domanda del libro di testo

Type I and Type II Errors

In Exercises 25–28, provide statements that identify the type I error and the type II error that correspond to the given claim. (Although conclusions are usually expressed in verbal form, the answers here can be expressed with statements that include symbolic expressions such as p = 0.1.)


The proportion of drivers who make angry gestures is greater than 0.25.

119
views
Domanda del libro di testo

Finding P-Values

In Exercises 13–16, do the following:


i. Identify the hypothesis test as being two-tailed, left-tailed, or right-tailed.

ii. Find the P-value. (See Figure 8-3.)

iii. Using a significance level of α = 0.05 should we reject H0 or should we fail to reject H0?


The test statistic of z = -0.75 is obtained when testing the claim that p<1/3.

165
views
Domanda del libro di testo

Randomization: Testing a Claim About a Mean

In Exercises 9–12, use the randomization procedure for the indicated exercise.

Section 8-3, Exercise 21 “Lead in Medicine”

112
views