Ch. 2 - Graphs of the Trigonometric Functions; Inverse Trigonometric Functions
Blitzer - Trigonometry 3rd Edition
Blitzer3rd EditionTrigonometryISBN: 9780137316601Non è quello che usi tu?Cambia libro di testo
Capitolo 2, Problema 13

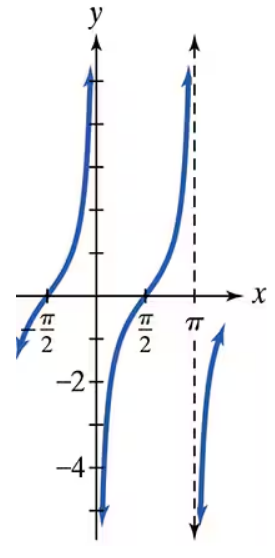
The graph of a cotangent function is given. Select the equation for each graph from the following options: y = cot(x + π/2), y = cot(x + π), y = −cot x, y= −cot(x − π/2).

Guida verificata passo dopo passo
1
Identify the vertical asymptotes of the cotangent graph. From the graph, the vertical asymptotes are at \(x = -\frac{2\pi}{3}\) and \(x = \frac{\pi}{3}\).
Recall that the standard cotangent function \(y = \cot x\) has vertical asymptotes at \(x = k\pi\), where \(k\) is an integer. The period of \(\cot x\) is \(\pi\).
Compare the given asymptotes with the standard cotangent asymptotes. The asymptotes here are shifted compared to the standard \(x = 0\) and \(x = \pi\) asymptotes of \(y = \cot x\).
Calculate the horizontal shift by comparing the asymptotes. The shift appears to be \(-\frac{\pi}{3}\) from the standard positions, indicating a phase shift in the function.
Match the phase shift and reflection with the given options. Since the graph is shifted and the shape matches a negative cotangent function shifted by \(\frac{\pi}{2}\), the equation corresponds to \(y = -\cot(x - \frac{\pi}{2})\).

Risposta video verificata per un problema simile:

Questa soluzione video è stata consigliata dai nostri tutor come utile per risolvere questo problema.
Durata del video:
4m

Concetti chiave

Ecco i concetti essenziali che devi comprendere per rispondere correttamente alla domanda.

Cotangent Function and Its Graph

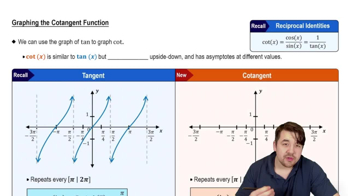
The cotangent function, cot(x), is the reciprocal of the tangent function and has vertical asymptotes where sin(x) = 0, i.e., at multiples of π. Its graph is periodic with period π, and it decreases from positive infinity to negative infinity between asymptotes. Understanding the shape and behavior of cot(x) is essential for identifying transformations.
Video consigliato:
Percorso guidato
5:37
Introduction to Cotangent Graph

Phase Shifts in Trigonometric Functions

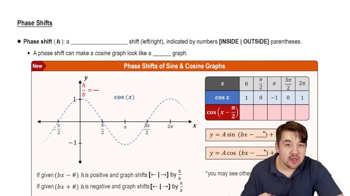
A phase shift in a trigonometric function like cot(x + c) shifts the graph horizontally by -c units. Positive inside the function shifts the graph to the left, and negative shifts it to the right. Recognizing how phase shifts affect the position of vertical asymptotes and zeros helps match the graph to its equation.
Video consigliato:

Reflection and Vertical Shifts of Cotangent

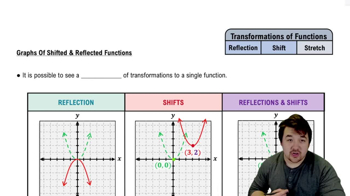
Multiplying cot(x) by -1 reflects the graph across the x-axis, reversing its increasing/decreasing behavior. This changes the sign of the function values but keeps the vertical asymptotes in the same place. Identifying reflections is key to distinguishing between equations like cot(x) and -cot(x).
Video consigliato:
Percorso guidato
4:25
Graphs of Shifted and Reflected Functions