In Exercises 29–51, find the exact value of each expression. Do not use a calculator. sin⁻¹(cos 2π/3)
Ch. 2 - Graphs of the Trigonometric Functions; Inverse Trigonometric Functions

Tutti i libri di testo
Blitzer 3rd Edition
Ch. 2 - Graphs of the Trigonometric Functions; Inverse Trigonometric Functions
Problema 53
Blitzer 3rd Edition
Ch. 2 - Graphs of the Trigonometric Functions; Inverse Trigonometric Functions
Problema 53Capitolo 2, Problema 53
In Exercises 53–60, use a vertical shift to graph one period of the function. y = sin x + 2
Guida verificata passo dopo passo1
Identify the base function and its characteristics. Here, the base function is \(y = \sin x\), which has a period of \(2\pi\), an amplitude of 1, and oscillates between -1 and 1.
Understand the effect of the vertical shift. The function \(y = \sin x + 2\) shifts the entire sine curve upward by 2 units, so the midline of the graph moves from \(y=0\) to \(y=2\).
Determine the new range of the function after the vertical shift. Since the original sine function ranges from -1 to 1, adding 2 shifts this range to \(1 \leq y \leq 3\).
Plot one period of the function from \(x=0\) to \(x=2\pi\). At key points: \(x=0\), \(x=\frac{\pi}{2}\), \(x=\pi\), \(x=\frac{3\pi}{2}\), and \(x=2\pi\), calculate the corresponding \(y\) values using \(y = \sin x + 2\).
Sketch the graph using the calculated points, ensuring the wave oscillates smoothly between \(y=1\) and \(y=3\) with the midline at \(y=2\), completing one full period over the interval \([0, 2\pi]\).

Risposta video verificata per un problema simile:
Questa soluzione video è stata consigliata dai nostri tutor come utile per risolvere questo problema.
Durata del video:
4mConcetti chiave
Ecco i concetti essenziali che devi comprendere per rispondere correttamente alla domanda.
Vertical Shift in Trigonometric Functions
A vertical shift moves the entire graph of a function up or down without changing its shape. For y = sin x + 2, the '+2' shifts the sine curve two units upward, raising the midline from y = 0 to y = 2.
Video consigliato:
Percorso guidato
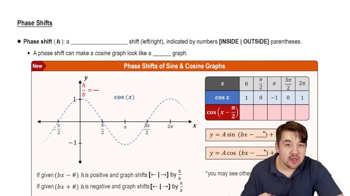
Phase Shifts
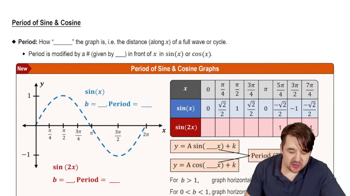
Period of the Sine Function
The period of the sine function is the length of one complete cycle, which is 2π for y = sin x. Graphing one period means plotting the function from 0 to 2π to capture a full wave of the sine curve.
Video consigliato:
Percorso guidato
Period of Sine and Cosine Functions
Graphing Sine Functions
Graphing sine functions involves plotting key points such as maxima, minima, and zeros over one period. For y = sin x + 2, these points are shifted vertically, so the maximum is at y = 3, minimum at y = 1, and midline at y = 2.
Video consigliato:
Percorso guidato
Graph of Sine and Cosine Function
Pratica correlata
Domanda del libro di testo
740
views
Domanda del libro di testo
In Exercises 43–52, determine the amplitude, period, and phase shift of each function. Then graph one period of the function. y = 2 cos (2πx + 8π)
563
views
Domanda del libro di testo
In Exercises 53–54, let f(x) = 2 sec x, g(x) = −2 tan x, and h(x) = 2x − π/2. Graph two periods of y = (f∘h)(x).
733
views
Domanda del libro di testo
In Exercises 52–53, use a right triangle to write each expression as an algebraic expression. Assume that x is positive and that the given inverse trigonometric function is defined for the expression in x. sec(sin⁻¹ 1/x)
676
views
Domanda del libro di testo
In Exercises 39–54, find the exact value of each expression, if possible. Do not use a calculator. sin(sin⁻¹ π)
1001
views
Domanda del libro di testo
In Exercises 39–54, find the exact value of each expression, if possible. Do not use a calculator. sin⁻¹ (sin π)
776
views