Ch. 5 - Complex Numbers, Polar Coordinates and Parametric Equations
Blitzer - Trigonometry 3rd Edition
Blitzer3rd EditionTrigonometryISBN: 9780137316601Non è quello che usi tu?Cambia libro di testo
Capitolo 5, Problema 13

Graph each polar equation. r = 1 + sin θ

Guida verificata passo dopo passo
1
Understand the given polar equation: \(r = 1 + \sin \theta\). This equation expresses the radius \(r\) as a function of the angle \(\theta\) in polar coordinates.
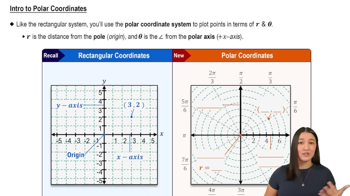
Recall that in polar coordinates, \(r\) is the distance from the origin and \(\theta\) is the angle measured from the positive x-axis. To graph the equation, you will plot points \((r, \theta)\) for various values of \(\theta\) between \(0\) and \(2\pi\).
Create a table of values by choosing several values of \(\theta\) (for example, \(0\), \(\frac{\pi}{6}\), \(\frac{\pi}{4}\), \(\frac{\pi}{2}\), \(\pi\), \(\frac{3\pi}{2}\), \(2\pi\)) and calculate the corresponding \(r\) using the formula \(r = 1 + \sin \theta\).
Plot each point on the polar coordinate plane by moving \(r\) units from the origin at the angle \(\theta\). Connect these points smoothly to reveal the shape of the graph.
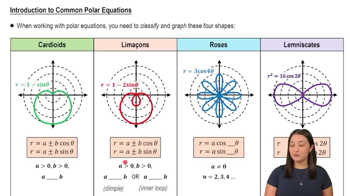
Recognize that the graph of \(r = 1 + \sin \theta\) is a cardioid, a heart-shaped curve, which is symmetric about the vertical axis. This understanding helps in sketching the curve accurately.

Risposta video verificata per un problema simile:

Questa soluzione video è stata consigliata dai nostri tutor come utile per risolvere questo problema.
Durata del video:
2m

Concetti chiave

Ecco i concetti essenziali che devi comprendere per rispondere correttamente alla domanda.

Polar Coordinates and Polar Equations

Polar coordinates represent points in a plane using a radius and an angle (r, θ) instead of Cartesian coordinates (x, y). A polar equation expresses the radius r as a function of the angle θ, allowing the graph to be plotted by calculating r for various θ values.
Video consigliato:
Percorso guidato
05:32
Intro to Polar Coordinates

Graphing Polar Equations

To graph a polar equation like r = 1 + sin θ, compute r for multiple θ values between 0 and 2π, then plot the points (r, θ) in polar form. Connecting these points reveals the shape, which often corresponds to known curves such as circles, cardioids, or limacons.
Video consigliato:
Percorso guidato
3:47
Introduction to Common Polar Equations

Properties of the Sine Function in Polar Graphs

The sine function varies between -1 and 1, affecting the radius r in the equation r = 1 + sin θ. This variation creates characteristic shapes like cardioids or limacons, where the maximum and minimum values of sin θ determine the curve's size and symmetry relative to the polar axis.
Video consigliato:
Percorso guidato
5:53
Graph of Sine and Cosine Function