Ch. 5 - Complex Numbers, Polar Coordinates and Parametric Equations
Blitzer - Trigonometry 3rd Edition
Blitzer3rd EditionTrigonometryISBN: 9780137316601Non è quello che usi tu?Cambia libro di testo
Capitolo 5, Problema 19

In Exercises 9–20, use point plotting to graph the plane curve described by the given parametric equations. Use arrows to show the orientation of the curve corresponding to increasing values of t. x = 2t, y = |t − 1|; −∞ < t < ∞

Guida verificata passo dopo passo
1
Understand the parametric equations given: \(x = 2t\) and \(y = |t - 1|\), where \(t\) ranges over all real numbers from \(-\infty\) to \(\infty\). The goal is to plot points \((x, y)\) on the plane as \(t\) changes and show the direction of increasing \(t\).
Recognize that \(y = |t - 1|\) is a piecewise function. For \(t < 1\), \(y = 1 - t\), and for \(t \geq 1\), \(y = t - 1\). This will affect how the curve behaves on either side of \(t = 1\).
Create a table of values by choosing several values of \(t\) (for example, \(t = 0, 0.5, 1, 1.5, 2\) and also some negative values like \(t = -1, -0.5\)). For each \(t\), calculate \(x = 2t\) and \(y = |t - 1|\) to get points \((x, y)\) to plot.
Plot the points on the coordinate plane using the calculated \((x, y)\) pairs. Connect the points smoothly, keeping in mind the piecewise nature of \(y\) and that the curve will have a 'V' shape due to the absolute value.
Add arrows along the curve to indicate the orientation corresponding to increasing \(t\). Since \(x = 2t\) increases as \(t\) increases, the arrows should point from left to right along the curve.

Risposta video verificata per un problema simile:

Questa soluzione video è stata consigliata dai nostri tutor come utile per risolvere questo problema.
Durata del video:
7m

Concetti chiave

Ecco i concetti essenziali che devi comprendere per rispondere correttamente alla domanda.

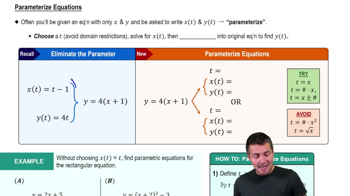
Parametric Equations

Parametric equations express the coordinates of points on a curve as functions of a parameter, usually denoted t. Instead of y as a function of x, both x and y depend on t, allowing the description of more complex curves and motions.
Video consigliato:
Percorso guidato
08:02
Parameterizing Equations

Graphing Parametric Curves

To graph parametric curves, plot points (x(t), y(t)) for various values of t and connect them smoothly. This method helps visualize the shape and behavior of the curve, especially when y is not a single-valued function of x.
Video consigliato:
Percorso guidato
04:47
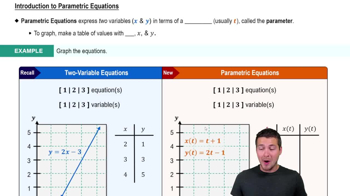
Introduction to Parametric Equations

Orientation and Direction of Parametric Curves

Orientation indicates the direction in which the curve is traced as the parameter t increases. Using arrows on the graph shows this direction, which is important for understanding the curve's progression and any time-dependent phenomena.
Video consigliato:
Percorso guidato
04:47
Introduction to Parametric Equations