Ch. 4 - Graphs of the Circular Functions
Lial - Trigonometry 12th Edition
Lial12th EditionTrigonometryISBN: 9780136552161, 9780135440780, 9780136881117, 9780135440827, 9780135924891Non è quello che usi tu?Cambia libro di testo
Capitolo 5, Problema 4.31

Graph each function over a two-period interval. Give the period and amplitude. See Examples 2–5.
y = -2 cos 3x

Guida verificata passo dopo passo
1
Identify the standard form of the cosine function: \( y = a \cos(bx + c) + d \). In this case, \( a = -2 \), \( b = 3 \), \( c = 0 \), and \( d = 0 \).
Determine the amplitude of the function. The amplitude is the absolute value of \( a \), which is \( |a| = |-2| = 2 \).
Calculate the period of the function. The period of a cosine function is given by \( \frac{2\pi}{b} \). Here, \( b = 3 \), so the period is \( \frac{2\pi}{3} \).
To graph the function over a two-period interval, calculate the interval length: \( 2 \times \frac{2\pi}{3} = \frac{4\pi}{3} \).
Sketch the graph of \( y = -2 \cos 3x \) over the interval \( [0, \frac{4\pi}{3}] \), noting that the graph will have peaks at \( y = 2 \) and troughs at \( y = -2 \), with a period of \( \frac{2\pi}{3} \).

Risposta video verificata per un problema simile:

Questa soluzione video è stata consigliata dai nostri tutor come utile per risolvere questo problema.

Concetti chiave

Ecco i concetti essenziali che devi comprendere per rispondere correttamente alla domanda.

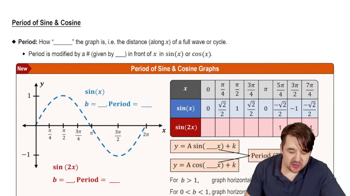
Period of a Trigonometric Function

The period of a trigonometric function is the length of one complete cycle of the wave. For the cosine function, the standard period is 2π. When the function is modified by a coefficient, such as in y = -2 cos(3x), the period is calculated by dividing the standard period by the coefficient of x, resulting in a period of 2π/3.
Video consigliato:
Percorso guidato
5:33
Period of Sine and Cosine Functions

Amplitude of a Trigonometric Function

Amplitude refers to the maximum height of the wave from its midline. In the function y = -2 cos(3x), the amplitude is the absolute value of the coefficient in front of the cosine, which is 2. This means the graph will oscillate between 2 and -2, indicating the vertical stretch of the wave.
Video consigliato:
Percorso guidato
6:04
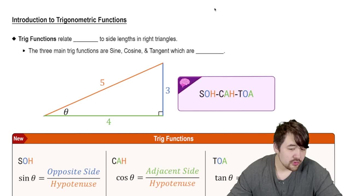
Introduction to Trigonometric Functions

Graphing Trigonometric Functions

Graphing trigonometric functions involves plotting the values of the function over a specified interval. For y = -2 cos(3x), the graph will reflect the amplitude and period, showing a cosine wave that starts at its maximum value (due to the negative sign, it starts at -2) and oscillates within the range of -2 to 2 over the calculated period.
Video consigliato:
Percorso guidato
6:04
Introduction to Trigonometric Functions