Ch. 4 - Graphs of the Circular Functions
Lial - Trigonometry 12th Edition
Lial12th EditionTrigonometryISBN: 9780136552161, 9780135440780, 9780136881117, 9780135440827, 9780135924891Non è quello che usi tu?Cambia libro di testo
Capitolo 5, Problema 4.15

Graph each function over the interval [-2π, 2π]. Give the amplitude. See Example 1.
y = ⅔ sin x

Guida verificata passo dopo passo
1
Identify the function type: The given function is y = \(\frac{2}{3}\) \(\sin\) x, which is a sine function.
Determine the amplitude: The amplitude of a sine function y = a \(\sin\) x is the absolute value of the coefficient a. Here, a = \(\frac{2}{3}\), so the amplitude is \(\left\)|\(\frac{2}{3}\)\(\right\)|.
Set the interval for graphing: The problem specifies the interval [-2\(\pi\), 2\(\pi\)]. This means you will graph the function from x = -2\(\pi\) to x = 2\(\pi\).
Plot key points: For the sine function, key points occur at x = 0, \(\frac{\pi}{2}\), \(\pi\), \(\frac{3\pi}{2}\), and 2\(\pi\), and their corresponding negative values. Calculate y for these x-values using y = \(\frac{2}{3}\) \(\sin\) x.
Sketch the graph: Use the key points and the amplitude to sketch the sine wave, ensuring it oscillates between -\(\frac{2}{3}\) and \(\frac{2}{3}\) over the interval [-2\(\pi\), 2\(\pi\)].

Risposta video verificata per un problema simile:

Questa soluzione video è stata consigliata dai nostri tutor come utile per risolvere questo problema.

Concetti chiave

Ecco i concetti essenziali che devi comprendere per rispondere correttamente alla domanda.

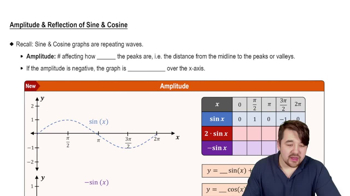
Amplitude

Amplitude refers to the maximum distance a wave reaches from its central position, which is crucial in understanding the height of trigonometric functions like sine and cosine. For the function y = ⅔ sin x, the amplitude is ⅔, indicating that the graph will oscillate between -⅔ and ⅔. This concept helps in visualizing the vertical stretch or compression of the sine wave.
Video consigliato:
Percorso guidato
5:05
Amplitude and Reflection of Sine and Cosine

Graphing Trigonometric Functions

Graphing trigonometric functions involves plotting the values of the function over a specified interval, in this case, [-2π, 2π]. Understanding the periodic nature of sine functions, which repeat every 2π, is essential for accurately representing the function's behavior across the given interval. This includes identifying key points such as intercepts, maximums, and minimums.
Video consigliato:
Percorso guidato
6:04
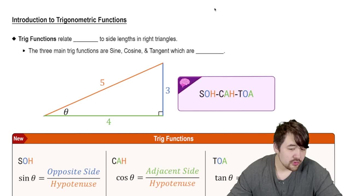
Introduction to Trigonometric Functions

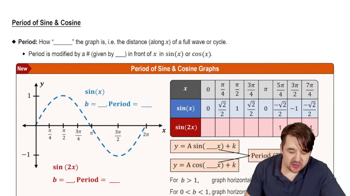
Period of the Sine Function

The period of a sine function is the length of one complete cycle of the wave. For the standard sine function, the period is 2π, meaning it repeats every 2π units along the x-axis. In the function y = ⅔ sin x, the period remains 2π, which is important for determining how many cycles will fit within the interval [-2π, 2π] and for accurately sketching the graph.
Video consigliato:
Percorso guidato
5:33
Period of Sine and Cosine Functions