뒤로
Analytical Chemistry: Chemical Measurements, Calibration, Errors, and Data Validation
스터디 가이드 - 스마트 노트
 자료에 맞춘 맞춤형 노트, 핵심 정의, 예시, 맥락을 확장해 제공합니다.
Chemical Measurements and Data Analysis
Introduction to Analytical Chemistry
Analytical Chemistry is a branch of chemistry focused on the separation, identification, and quantification of materials. It is essential in fields such as medicine, forensic science, engineering, and environmental science. Analytical methods are divided into qualitative (identifying analytes) and quantitative (determining amounts) approaches.
Qualitative Analysis: Identifies the presence of specific substances.
Quantitative Analysis: Measures the amount of a substance present.
Applications: Used in clinical diagnostics, environmental monitoring, and industrial quality control.
Steps in Quantitative Chemical Analysis
Quantitative analysis follows a systematic process to ensure accurate and reliable results:
Define the Problem: Specify what is to be found.
Select a Method: Choose between classical and instrumental methods based on accuracy, sample number, and complexity.
Obtain Representative Sample: Ensure the sample reflects the whole.
Prepare the Sample: Process the sample for analysis.
Perform Chemical Separations: Isolate analytes if necessary.
Perform Measurement: Use appropriate instruments or techniques.
Calculate and Report Results: Analyze data and communicate findings.
Experimental Error and Quality Assurance
Types of Errors in Chemical Analysis
Understanding errors is crucial for ensuring data integrity in analytical chemistry.
Gross (Human) Errors: Major mistakes due to carelessness or instrument failure. Example: Recording 22.0°C as 20.2°C.
Systematic Errors (Bias): Determinable and correctable errors, such as using an uncalibrated pipet. Regular calibration minimizes these errors.
Random Errors: Indeterminate errors inherent to all measurements, caused by uncontrolled variables. These can be reduced by repeated measurements.
Managing and Resolving Errors
Gross Errors: Prevented by careful technique and instrument maintenance.
Systematic Errors: Managed by calibration, standardization, and method validation.
Random Errors: Reduced by increasing the number of replicates and statistical analysis.
Calibration and Standardization
Calibration Methods
Calibration establishes the relationship between instrument response and analyte concentration. Three main methods are used:
External Standard Calibration: Uses a series of known standards to construct a calibration curve.
Internal Standard Calibration: Adds a known quantity of a different substance (internal standard) to compensate for random and systematic errors.
Standard Addition Calibration: Spikes the sample with known amounts of analyte to compensate for matrix interferences.
Preparation of Calibration Standards
Purchase high purity analyte.
Prepare a stock solution (e.g., 1000 mg/L).
Make serial dilutions to obtain standards of increasing concentrations (e.g., 0.10, 0.50, 1.00, 5.00, 10.0 mg/L).
Analyze standards to obtain instrument response.
Least-Squares Method for Calibration Curve
The best calibration line is determined using the least-squares method:
Equation:
Slope (m):
Intercept (b):
Example: Using calibration data, calculate the slope and intercept to determine the concentration of an unknown sample.

Calibration Uncertainties
Standard Deviation of Regression (Sy/x):
Uncertainty of Slope (Sm):
Uncertainty of Intercept (Sb):
Data Validation and Method Validation
Figures of Merit for Method Validation
Precision: Degree of agreement between replicate measurements.
Accuracy: Agreement between measured and true value.
Linearity: Linear relationship between response and concentration.
Sensitivity: Ability to distinguish between close concentrations.
Selectivity: Ability to measure analyte without interference.
Robustness and Ruggedness: Consistency under varying conditions.
Limit of Detection (LOD) and Limit of Quantification (LOQ): Lowest detectable and quantifiable concentrations.
Accuracy and Precision
Absolute Error (E):
Relative Error (Er):
Precision: Expressed by standard deviation, relative standard deviation, and confidence interval.
Linearity and Sensitivity
Linearity: Confirmed by measuring multiple concentration levels and assessing the coefficient of determination ().
Sensitivity: Determined by the slope of the calibration curve.
Limit of Detection (LOD) and Limit of Quantification (LOQ)
Instrumental Method: ,
Calibration Curve Method: ,
Statistical Analysis in Chemical Data
Basic Statistics: Mean, Variance, and Standard Deviation
Mean ():
Variance ():
Standard Deviation (s):
Relative Standard Deviation (RSD):
Confidence Level and Confidence Interval
Confidence Level: Degree of certainty that the true value lies within the confidence interval.
Confidence Interval: Range likely to contain the true value, calculated using the t-distribution.
Formula:
Outlier Tests: Dixon's Q-Test
Dixon's Q-test is used to determine if a value in a small data set is an outlier.
Formula:
If at a given confidence level, reject the suspected value.
If , accept the suspected value.
T-Test for Method Validation
The t-test is used to compare the mean of measured values to a true value or to compare means from two groups.
Formula:
If , the method is not accurate enough.
If , the method is considered accurate.

Quality Assurance in Analytical Chemistry
Elements of a Quality System
Blanks: Used to check for contamination and background signals.
Replicate Analysis: Ensures reliability and repeatability.
Reference Materials: Used to validate methods and calibrate instruments.
Inter-laboratory Comparison: Confirms consistency across different labs.
Training: Ensures analysts are competent.
Calibration: Maintains instrument accuracy.
Control Charts: Monitor ongoing performance.
Quality Audit and Review: Regular assessment of procedures and results.
Tables for Statistical Reference
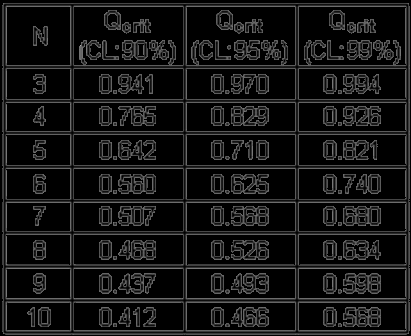
Dixon's Q-Test Critical Values
The table below provides critical values for Dixon's Q-test at different confidence levels and sample sizes.
N | Qcrit (CL:90%) | Qcrit (CL:95%) | Qcrit (CL:99%) |
|---|---|---|---|
3 | 0.941 | 0.970 | 0.994 |
4 | 0.765 | 0.829 | 0.926 |
5 | 0.642 | 0.710 | 0.821 |
6 | 0.560 | 0.625 | 0.740 |
7 | 0.507 | 0.568 | 0.680 |
8 | 0.468 | 0.526 | 0.634 |
9 | 0.437 | 0.493 | 0.598 |
10 | 0.412 | 0.466 | 0.568 |
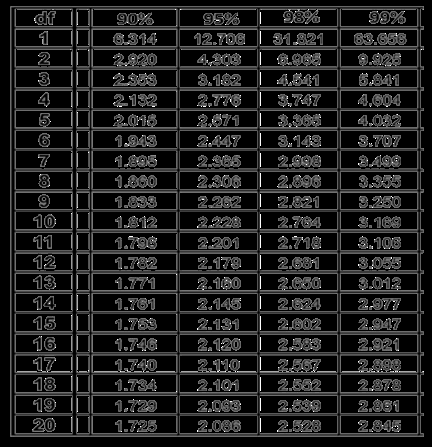
Student's t-Test Critical Values
The table below provides critical values for the Student's t-test at different confidence levels and degrees of freedom.
df | 90% | 95% | 98% | 99% |
|---|---|---|---|---|
1 | 6.314 | 12.706 | 31.821 | 63.656 |
2 | 2.920 | 4.303 | 6.965 | 9.925 |
3 | 2.353 | 3.182 | 4.541 | 5.841 |
4 | 2.132 | 2.776 | 3.747 | 4.604 |
5 | 2.015 | 2.571 | 3.365 | 4.032 |
6 | 1.943 | 2.447 | 3.143 | 3.707 |
7 | 1.895 | 2.365 | 2.998 | 3.499 |
8 | 1.860 | 2.306 | 2.896 | 3.355 |
9 | 1.833 | 2.262 | 2.821 | 3.250 |
10 | 1.812 | 2.228 | 2.764 | 3.169 |
11 | 1.796 | 2.201 | 2.718 | 3.106 |
12 | 1.782 | 2.179 | 2.681 | 3.055 |
13 | 1.771 | 2.160 | 2.650 | 3.012 |
14 | 1.761 | 2.145 | 2.624 | 2.977 |
15 | 1.753 | 2.131 | 2.602 | 2.947 |
16 | 1.746 | 2.120 | 2.583 | 2.921 |
17 | 1.740 | 2.110 | 2.567 | 2.898 |
18 | 1.734 | 2.101 | 2.552 | 2.878 |
19 | 1.729 | 2.093 | 2.539 | 2.861 |
20 | 1.725 | 2.086 | 2.528 | 2.845 |
Key Statistical Parameters
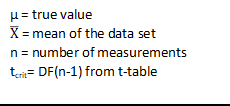
μ = true value
𝑋̅ = mean of the data set
n = number of measurements
tcrit = DF(n-1) from t-table
Learning Outcomes
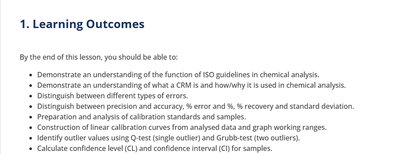
Understand ISO guidelines and CRM function in chemical analysis.
Distinguish between types of errors, precision, accuracy, % error, % recovery, and standard deviation.
Prepare and analyze calibration standards and samples.
Construct linear calibration curves and interpret graph working ranges.
Identify outlier values using Q-test and Grubb-test.
Calculate confidence level (CL) and confidence interval (CI) for samples.
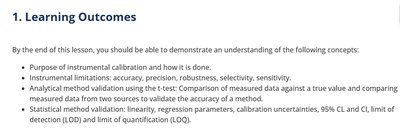
Understand instrumental calibration, limitations, and method validation using t-test.
Apply statistical method validation: linearity, regression, calibration uncertainties, LOD, LOQ.