 뒤로
Influenza Vaccines: Production, Effectiveness, and Public Health Impact
스터디 가이드 - 스마트 노트
 자료에 맞춘 맞춤형 노트, 핵심 정의, 예시, 맥락을 확장해 제공합니다.
Influenza Vaccine Production and Selection
Annual Vaccine Formulation and Strain Selection
Each year, influenza vaccines are formulated to protect against the most prevalent strains expected for the upcoming flu season. The selection process involves global surveillance and laboratory analysis to identify circulating virus types and subtypes.
Multivalent Vaccines: Most flu vaccines are multivalent, containing 3 or 4 strains (trivalent or quadrivalent) to maximize coverage.
Production Methods: Viruses are grown in chicken eggs or cell culture. Egg-based production is traditional, while cell-based and recombinant methods are alternatives for those with egg allergies.
Timeline: Vaccine strain selection occurs in February for the following season, allowing time for production and distribution.
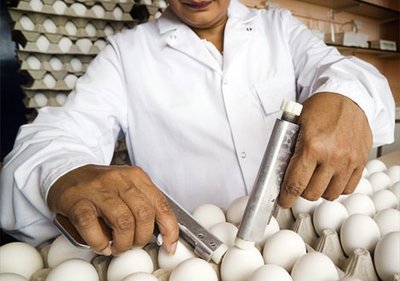
Example: The 2024–2025 influenza vaccine includes specific H1N1, H3N2, and B strains, with slight differences between egg-based and cell-based formulations.
CDC Laboratory Work and Surveillance
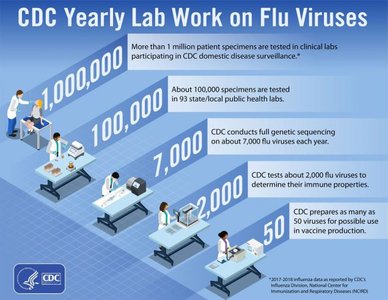
The CDC conducts extensive laboratory work to monitor flu viruses and inform vaccine development. This includes specimen testing, genetic sequencing, and immune property analysis.
Over 1 million patient specimens are tested annually in clinical labs.
About 100,000 specimens are tested in state/local public health labs.
CDC sequences about 7,000 flu viruses and tests 2,000 for immune properties.
Up to 50 viruses are prepared for possible use in vaccine production.
Vaccine Effectiveness and Immunity
Immunization Outcomes
Influenza vaccines are designed to prevent illness and reduce the severity of flu outbreaks. Immunity develops approximately two weeks after vaccination.
Effectiveness: Vaccines are 70–90% effective in healthy adults, but effectiveness is lower in the elderly.
Safety: The vaccine cannot cause influenza illness.
Timing: Vaccination is recommended by October for optimal protection.
Co-administration: COVID-19 and flu vaccines can be given at the same time.
Community Impact: Vaccinating children helps reduce spread and protects vulnerable populations.
Vaccine Recommendations and Antiviral Medications
Who Should Get Vaccinated?
Seasonal flu vaccination is recommended for nearly everyone aged 6 months and older, with few exceptions.
Exceptions: Individuals allergic to eggs (egg-free vaccines are available) or those ill with fever should consult healthcare providers.
High-Risk Groups: Pregnant women, young children, older adults, and those with chronic illnesses or in nursing homes are especially encouraged to receive antiviral medications if infected.
Public Health Impact of Influenza
Annual Disease Burden
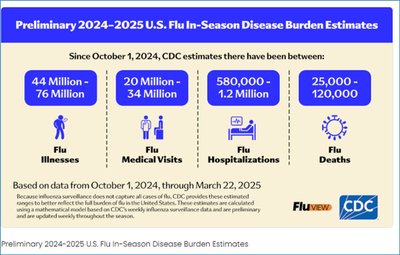
Influenza remains a significant public health concern, causing substantial morbidity and mortality each year.
Even in a typical year, flu kills approximately 36,000 people in the U.S. and hospitalizes about 200,000.
Most deaths occur among the very young and very old.
Influenza Surveillance and Epidemiology
Tracking Flu Activity
Public health agencies monitor influenza activity through laboratory testing and epidemiological reports. Surveillance data inform vaccine strain selection and public health responses.
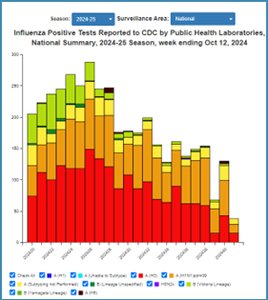
Positive Test Reports: Weekly summaries show the number of influenza-positive tests by strain and region.
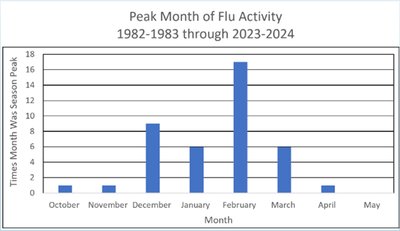
Peak Activity: Most flu seasons peak in February, but activity can vary year to year.
Geographic Spread: Maps indicate local, regional, and widespread flu activity across the U.S.
Mortality Surveillance
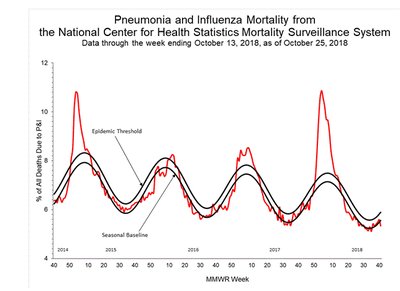
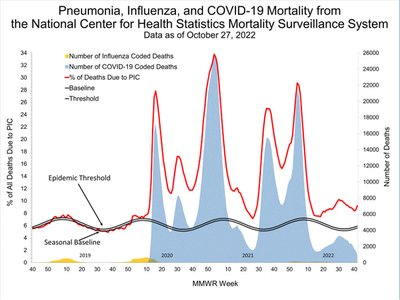
Mortality data from pneumonia and influenza are tracked to identify epidemic thresholds and seasonal trends.
Graphs show the percentage of deaths due to pneumonia and influenza, with epidemic thresholds marked.
COVID-19 has impacted recent mortality patterns, as shown in combined surveillance graphs.
Summary Table: Influenza Vaccine Production and Public Health Impact
Aspect | Description |
|---|---|
Vaccine Formulation | Multivalent (3-4 strains), updated annually based on surveillance |
Production Methods | Egg-based, cell-based, recombinant |
Effectiveness | 70–90% in healthy adults, lower in elderly |
Recommendations | Everyone 6 months and older, with exceptions for allergies/illness |
Annual Impact | 36,000 deaths, 200,000 hospitalizations (U.S.) |
Surveillance | CDC lab testing, strain selection, epidemiological tracking |
